Slope, Mathematics

Assignment Help:

One of the more significant ideas that we'll be discussing in this section is slope. The slope of a line is a measure of the steepness of any particular line and it can also be utilized to measure whether a line is increasing line or decreasing line as we move from left to right.  Here is the particular definition of the slope of a line.

Specified any two points on the line say, ( x1 , y1 ) and ( x2 , y2 ) , the slope of the line is given by,

                                         m = y2 - y1 /x2 - x1

In other terms, the slope is the difference in the y values divided by the difference in the x values. Also, do not get worried regarding the subscripts on the variables. These are utilized fairly regularly from this point on & are simply utilized to indicate the fact that the variables are both x or y values but are, in all probability, different.

While using this definition do not worry regarding which point must be the first point and which point must be the second point.  You can select either to be the first and/or second and we'll get exactly the similar value for the slope.

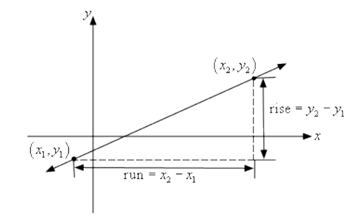
There is also a geometric "definition" of the slope of the line as well.  You will frequently hear the slope as being described as follows,

                                                  m = rise/ run

The two definitions are alike as the following diagram shown. The numerators & denominators of both definitions are the similar.

1728_Slope.png

Notice as well that if we have the slope (written as a fraction) & a point on the line, say ( x1 , y1 ) , then we can determine a second point easily which is also on the line.  Before seeing how it can be done let's take the convention that if the slope is -ve we will put the minus sign on the numerator of the slope. In other terms, we will suppose that the rise is negative if the slope is negative.

Note as well that a negative rise is actually a fall.

Thus, we have the slope, written as a fraction, and a point on the line, ( x1 , y1 ) . To get the coordinates of the second point, ( x2 , y2 ) all that we have to do is start at ( x1 , y1 ) then move to the right by the run (or denominator of the slope) and then up/down by rise (or the numerator of the slope) based on the sign of the rise.  We can also write down some of equations for the coordinates of the second point as follows,

                             x2  = x1 + run

                            y2  = y1 + rise

Note that if the slope is -ve then the rise will be a negative number. Let's calculate a couple of slopes.


Related Discussions:- Slope

Find the common difference & write the next 3 terms, If the following terms...

If the following terms form a AP. Find the common difference & write the next 3 terms3, 3+ √2, 3+2√2, 3+3√2.......... Ans:    d= √2 next three terms 3 + 4 √ 2 , 3 + 5√ 2 ,

Prove that ac2 =ab2 + bc2+2bcxbd, If ABC is an obtuse angled triangle, obtu...

If ABC is an obtuse angled triangle, obtuse angled at B and if AD⊥CB Prove that AC 2 =AB 2 + BC 2 +2BCxBD Ans:    AC 2 = AD 2 + CD 2 = AD 2 + (BC + BD) 2 = A

Scatter graphs, Scatter Graphs - A scatter graph is a graph that compr...

Scatter Graphs - A scatter graph is a graph that comprises of points which have been plotted but are not joined through line segments - The pattern of the points will defin

What is exponential functions, What is Exponential Functions ? Exponent La...

What is Exponential Functions ? Exponent Laws Review: A) Ax / Ay = A(x + y) B) Ax / Ay = A(x - y) C) (ABC)x = AxBxCx D) ((Ax)y)z = Axyz E) (A/B)x = Ax /Bx Definition

Calculate the volume and surface area of a sphere, Calculate the volume and...

Calculate the volume and surface area of a sphere: Calculate the volume and surface area of a sphere with r = 4".  Be sure to include units in your answer. Solution: V

Example of one-to-one correspondence, An educator placed 10 pebbles in a ro...

An educator placed 10 pebbles in a row and asked four-year-old Jaswant to count how many there were. She asked him to touch the pebbles .while counting them. Jaswant counted the pe

The median- graphical method -progression , The median - it is a stati...

The median - it is a statistical value which is usually located at the center of a given set of data that has been organized in the order of size or magnitude as illustrating,

Integration, sketch the curve y=9-x2 stating the coordinates of the turning...

sketch the curve y=9-x2 stating the coordinates of the turning point and of the intersections with the axes.

Write Your Message!

Captcha
Free Assignment Quote

Assured A++ Grade

Get guaranteed satisfaction & time on delivery in every assignment order you paid with us! We ensure premium quality solution document along with free turntin report!

All rights reserved! Copyrights ©2019-2020 ExpertsMind IT Educational Pvt Ltd