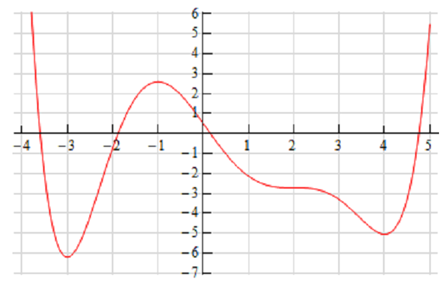
Below is the sketch of a function f ( x ) . Sketch the graph of the derivative of this function f ′ ( x ) .
Solution : At first glance it seems to an all however impossible task. Though, if you have some fundamental knowledge of the interpretations of the derivative you can get sketch of the derivative. It will not be perfect sketch for the most of the part, but you have to be able to get most basic features of the derivative in the sketch.
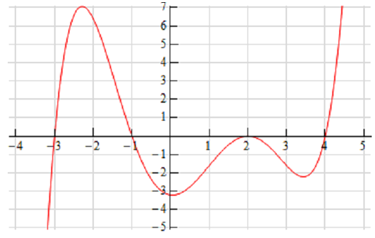
Let's begin with the given sketch of the function with a couple of additions.
Notice as well that at x = -3 , x = -1 ,x = 2 and x = 4 the tangent line to the function is horizontal.
It means that the slope of the tangent line has to be zero. Now, we know that the slope of the tangent line at a specific point is also the value of the derivative of function at that point.
Thus, now we know that,
f ′ ( -3) = 0 f ′ ( -1) = 0 f ′ ( 2) = 0 f ′ ( 4) = 0
It is a good beginning point for us. It gives us few points on the graph of the derivative. It also breaks the domain of function up into regions where the function is increasing & decreasing. We know that if the function is increasing at point then the derivative has to be positive at that point. Similarly, we know that if the function is decreasing at point then the derivative has to be negative at that point.
Now we can give the following information regarding the derivative.
x < -3 f ′ ( x ) < 0
-3 < x < -1 f ′ ( x ) > 0
-1 < x < 2 f ′ ( x ) < 0
2 < x < 4 f ′ ( x ) > 0
x > 4 f ′ ( x ) < 0
Recall that we are giving the signs of the derivatives here & these are exclusively a function of whether the function is increasing / decreasing. The sign of function itself is totally immaterial here & will not in any way effect the sign of the derivative.
It may still seem like we don't have sufficient information to get a sketch, however we can get a little more information regarding the derivative from the graph of the function. In the range x < -3 .we know that the derivative has to be negative, though we can also see that the derivative has to be increasing in this range. Here it is -ve until we reach x = -3 and at this point the derivative has to be zero. The only way for the derivative to be -ve to the left of
x = -3 and zero at x = -3 is for the derivative to enhance as we increase x towards x = -3 .
Now, in the range -3 < x < -1 we know that the derivative has to be zero at the endpoints and positive between the two endpoints. Directly to the right of x = -3 the derivative has to also be increasing (since it starts at zero and then goes positive - thus it has to be increasing). Thus, the derivative in this range has to start out increasing and has to eventually get back to zero at x = -1 . Thus, at some point in this interval the derivative has to start decreasing before it attain x = -1 . Now, we ought to be careful here since this is just general behavior here at the two endpoints. We won't know where the derivative goes from increasing through decreasing & it may well change among increasing & decreasing many times before we reach x = -1 . All we can actually say is that immediately to the right of x =-3 the derivative will be increasing and instantly to the left of x = -1 the derivative will be decreasing.
Next, for the ranges -1 < x < 2 & 2 < x < 4 we know derivative will be zero at the endpoints & negative in between. Also, following the kind of reasoning given above we can illustrates in each of these ranges that the derivative will be decreasing only to the right of left hand endpoint & increasing only to the left of the right hand endpoint.
At last, in the last region x > 4 we know that the derivative is zero at x = 4 & positive to the right of x = 4. Once again, following the reasoning above, the derivative has to also be increasing in this range.
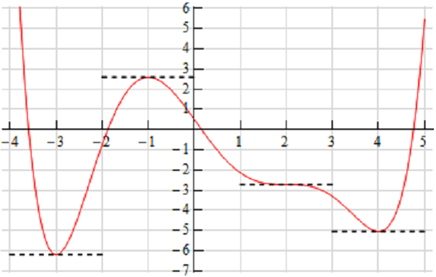
Putting all material together (& always taking the simplest option for increasing and/or decreasing information) gives us the given sketch for the derivative.
Note as well that it was done with the actual derivative and hence is in fact accurate. Any sketch you do will possibly not look quite the similar. The "humps" in each region may be at distinct places and/or different heights for instance. Also, note as well that we left off the vertical scale since given the information which we've got at this point there was no real way to know this information.
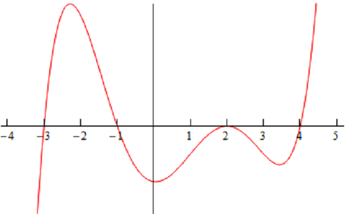
However, that doesn't mean that we can't get some ideas of particular points on the derivative other than where we know the derivative to be zero. In order to see this let's check out the following graph of the function (not the derivative, however the function).
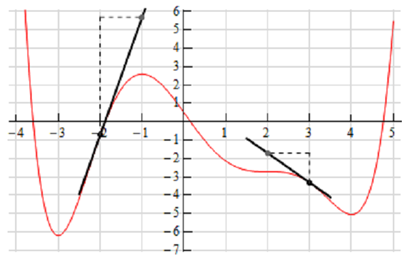
At x = -2 & x = 3 we've sketched in a couple of tangent lines. We can utilize the basic rise/run slope concept to estimate the value of the derivative at these points.
Let's begin at x = 3. Here we've got two points on the line. We can see that each appear to be about one-quarter of the way off the grid line. Thus, taking that into account and the fact that we go through one complete grid we can illustrates that the slope of the tangent line, and therefore the derivative, is approximately -1.5.
At x = -2 this looks like (with some heavy estimation) that the second point is around 6.5 grids above the first point and hence the slope of the tangent line here, and therefore the derivative, is around 6.5.
Following is the sketch of the derivative with the vertical scale involved and from this we can illustrate that actually our estimates are pretty close to reality.
Note as well that this idea of estimating values of derivatives can be a complicated process and does need a fair amount of (possible bad) approximations thus whereas it can be utilized, you have to be careful with it.