Sketch the graph of function, Algebra

Assignment Help:

Sketch the graph of function.

f ( x ) =3x + 6 /x -1

Solution

Thus, we'll start off with the intercepts. The y-intercept is,

      f (0) =6/-1=-6⇒     (0, -6)


The x-intercepts will be,

3x + 6 = 0

x = -2                   ⇒ ( -2, 0)

Now, we have to determine the asymptotes.  Let's first determine the vertical asymptotes.

x -1 =0                 ⇒   x = 1

Thus, we've got one vertical asymptote. It means that now there are two regions of x's. They are x < 1 and x > 1 .

Now, the largest exponent within the numerator & denominator is 1 and thus by the fact there will be a horizontal asymptote at the line.

                                                   y = 3/1 = 3

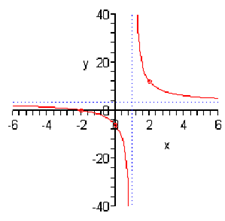
Now, we only need points in each region of x's.  As the y-intercept & x-intercept are already in the left region we won't have to get any points there.  It means that we'll only need to get a point in the right region.  It doesn't actually matter what value of x we pick here we only have to keep it rather small so it will fit onto our graph.

f ( 2) = 3( 2) + 6/2 -1 = 12 /1= 12   ⇒  ( 2,12)

Putting all this together illustrate the following graph.

1639_Sketch the graph of function.png


Related Discussions:- Sketch the graph of function

Ms. Pat, what is the simplified form of 5 square 32 - 4 square 18

what is the simplified form of 5 square 32 - 4 square 18

Example of double inequalities, Now, let's solve out some double inequaliti...

Now, let's solve out some double inequalities. The procedure here is alike in some ways to solving single inequalities and still very different in other ways. As there are two ineq

Exponents with variables and numbers, I need examples for a tutorial I have...

I need examples for a tutorial I have do in my AVID class.

Absolute value inequalities, In the earlier section we solved equations whi...

In the earlier section we solved equations which contained absolute values.  In this section we desire to look at inequalities which contain absolute values.  We will have to exami

Boolean logic-truth table and digital circuit diagram, Part A. relates to d...

Part A. relates to data representation and Part B. relates to Boolean logic.  Part A. Data Representation The very first thing you need to do to begin Part A is to make

Turning points - polynomials, The "humps" where the graph varies direction ...

The "humps" where the graph varies direction from increasing to decreasing or decreasing to increasing is frequently called turning points .  If we know that the polynomial con

Write Your Message!

Captcha
Free Assignment Quote

Assured A++ Grade

Get guaranteed satisfaction & time on delivery in every assignment order you paid with us! We ensure premium quality solution document along with free turntin report!

All rights reserved! Copyrights ©2019-2020 ExpertsMind IT Educational Pvt Ltd