Sketch the graph of the below function.
f ( x ) = - x5 + (5/2 )x4 + (40/3) x3 + 5
Solution : Whenever we sketch a graph it's good to have a few points on the graph to provide us a starting place. Thus we'll begin by the function at the critical points. These will provides us some starting points while we go to sketch the graph. These points are,
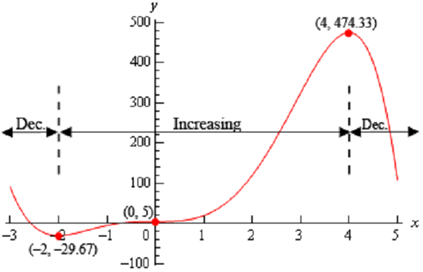
f ( -2) = - 89/3 = -29.67 f (0) = 5 f ( 4) = 1423/3 =474.33
Once these points are graphed we go to the increasing & decreasing information & begin sketching. For reference cause here is the increasing/decreasing information.
Increase : - 2 < x < 0 and 0 < x < 4
Decrease : - ∞ < x < -2 and 4 < x < ∞
Note as well that we are only after a sketch of the graph. As noted before we begun this example we won't be capable to accurately predict the curvature of the graph at this point. Though, even without this information still we will be capable to obtain a basic idea of what the graph have to look like.
To get this sketch we begin at the very left of the graph & knowing that the graph has to be decreasing & will continue to decrease till we get to x = -2 . At this point the function will continue to increase until it gets to x = 4 . However, note that during the increasing phase it does have to go through the point at x =0 and at this point we also know that the derivative is zero here and therefore the graph goes through x = 0 horizontally. At last, once we hit x = 4 the graph starts, & continues, to decrease. Also, note as well that just like at x = 0 the graph will have to be horizontal while it goes through the other two critical points as well.
Following is the graph of the function. Of course, we used a graphical program to plot this graph, though, outside of some potential curvature issues if you followed the increasing/decreasing information & had all the critical points plotted firstly you ought to have something similar to this.
