Siting Departments for Process Layout - Manufacturing
One of the most significant features of the siting of departments in a process layout is its surprising complexity. Even if we ignore the different possible shapes in which individual departments could be configured, there are n-factorial (n!) ways of arranging 'n' departments. For example, if there are 5 departments there are 120 possible arrangements (5! = 5 × 4 × 3 × 2 × 1 = 120); if there are 6 departments there are 720 arrangements; if there are 20 departments, then there are 2,432,902,008,176,640,000 possibilities (if you try to say this number you may struggle; it certainly ends with 'nine hundred and two trillion, eight billion, one hundred and seventy six million, six hundred and forty thousand').
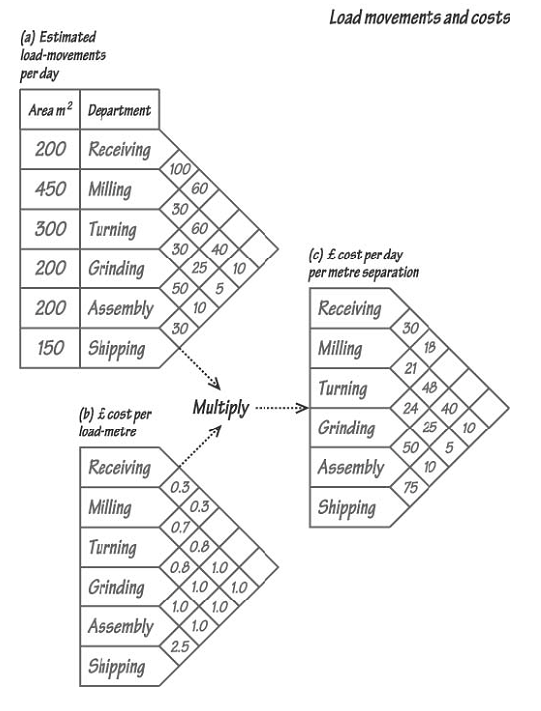
If alternative shapes of department are brought into consideration, then, to all intents and purposes, there is an infinite number of feasible layouts. In the face of this combinatorial complexity, how then are we to proceed? In the manufacture of products, a popular measure of layout effectiveness is its effect on material movement costs. If minimising these costs is a major criterion, a cut-and-try method of layout design is available, based on analysis of loads and their movement costs. We will illustrate the method using a simple example. The departments listed in this figure are to be laid out in a building of dimensions 50m × 30m. The grid in part (a) of the figure indicates the area required by each department, and the estimated number of load-movements per day between departments. For example, it is estimated that there will be 60 daily movements between the milling and grinding departments. The grid in part (b) of the figure indicates the estimated costs per metre of load-movement between departments.
For simplicity, it has been assumed that these costs are independent of direction ie the cost of movement from, say, milling to grinding is the same as from grinding to milling. The entries in the grid of part (c) are calculated as the product of the corresponding cells of (a) and (b), and represent the anticipated daily costs per metre travelled. For example, for every metre separating assembly and shipping it will cost £75 per day (ie 30 load-movements per day × £2.50 per load-metre travelled). The next step is to draw a schematic representation (see figure) of the departments, Schematic relationship diagram linked by arcs accentuated in accordance with the cost per metre per day. This initial arrangement may be chosen arbitrarily. This graphical representation facilitates the visualisation of alternative configurations that might reduce the total costs of movement.
The figure below on the left shows an amended diagram resulting from such scrutiny. It now remains to fit this arrangement to the space available, whilst observing the individual area requirements of the departments. The figure on the right shows one of many layouts which could have been drawn, all conforming to the relationships of the first figure. Before going on to complete the detailed design of this layout, other issues would be considered, including such things as the positions of roof- supporting pillars and other obstructions, provision of passageways, access for fork-lift trucks, etc. For example, although the layout of the right hand figure above may be suitable if the access road (or railway depot) is adjacent to a long side of the building, if it is adjacent to the short side, the layout may have to be amended, as shown in these two figures.