Q. Signals and spectral analysis?
Figure shows the functional block diagram of a signal-processing system. The information source may be a speech (voice), an image (picture), or plain text in some language. The output of a source that generates information may be described in probabilistic terms by a random variable, when the random or stochastic signal is defined by a probability density function. The output of a source may not be deterministic, given by a real or complex number at any instant of time. However, in view of the scope of this text, random signals and random processes are not discussed here.
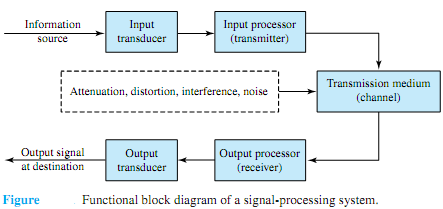
A transducer is usually required to convert the output of a source into an electrical signal that is suitable for transmission. Typical examples include a microphone converting an acoustic speech or a video camera converting an image into electric signals. A similar transducer is needed at the destination to convert the received electric signals into a form (such as voice, image, etc.) that is suitable for the user.The heart of any communication system consists of three basic elements: transmitter, transmission medium or channel, and receiver. The transmitter (input processor) converts the electric signal into a form that is suitable for transmission through the physical channel or transmission medium. For example, in radio and TV broadcasts, since the FCC (Federal Communications Commission) specifies the frequency range for each transmitting station, the transmitter must translate the information signal to be transmitted into the appropriate frequency range that matches the frequency allocation assigned to the transmitter. This process is called modulation, which usually involves the use of the information signal to vary systematically the amplitude, frequency, or phase of a sinusoidal carrier. Thus, in general, carrier modulation such as amplitude modulation (AM), frequency modulation (FM), or phase modulation (PM) is performed primarily at the transmitter. For example, for a radio station found at a setting of AM820, the carrier wave transmitted by the radio station is at the frequency of 820 kHz.
The function of the receiver is to recover the message signal contained in the received signal. If the message signal is transmitted by carrier modulation, the receiver performs carrier demodulation to extract the message from the sinusoidal carrier.