Q. Show the Fixed Proportion Production Function?
A fixed proportion production function is one in that technology needs a fixed combination of inputs, say labour and capital, to generate a given level of output. There is just one way in that factors may be combined to produce a given level of output efficiently. In this kind of production, there isn't any possibility of substitution between the factors of production.
Fixed proportion production function is explained by isoquants that are 'L' shaped or 'right angle' shaped. This is displayed in Figure below.
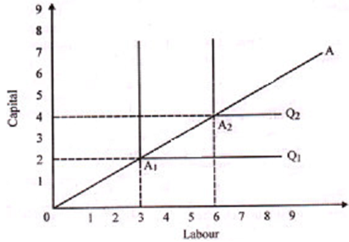
Figure: Fixed Proportion Production Function
Let's suppose that at point A, output is one unit. Isoquant Q1 passing through the point A1 displays that one unit of output is produced by employing 2 units of capital and 3 units of labour. Or we can say that capital-labour ratio is 2:3. In this case with 2 units of capital, any increase in labour beyond 3 units won't increase output and so labour beyond 3 units is redundant. In the same way, with 3 units of labour, any increase in capital beyond 2 units is redundant. Kink point demonstrates the most efficient combination of factors.
Capital labour ratio should be maintained for any level of output. Output can be doubled by doubling quantity of inputs, which is, two units of output can be generated by 4 units of capital and 6 units of labour. So isoquant Q2 passes through the point A2. Line OA describes a production process, which is, a way of combining inputs to attain certain output. Slope of the line demonstrates the capital-labour ratio.
Fixed proportion production function is characterized by constant returns to scale, which is, a proportionate increase in inputs results in a proportionate increase in outputs.
This kind of production function provides the basis for the input-output analysis in economics. Thus, this kind of isoquant is also known as input-output isoquant or 'leontiff' isoquant after Leontiff who invented the input-output analysis.