Seasonal-Component Analysis:
A food processor uses a moving average to forecast next month's demand. Actual demand data for the past few months is available as depicted in the following table.
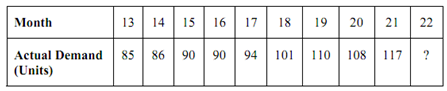
(a) Calculate a simple five-month moving average to forecast demand for month 22.
(b) Calculate a weighted three month moving average where the weights are highest for the latest month and descend in order of 3, 2, 1.
Solution
(a) While only one 5-month moving average is needed, it is taken as the average of the demand for the last 5 months for which the data is available.
So, MA = (117 + 108 + 110 + 101 + 94) /5 = 106 units
Therefore forecast for the 22nd month = 106 units
This value of MA is a deseasonalised monthly demand. While the actual demand for 22nd month becomes known, a new moving average is computed by dropping the oldest monthly demand (that means of 17th month) and including the most recent one of 22nd month.
(b) MAweight = ∑ (weight) (X ) /∑ (weight)
Weight Value Total
3 × 117 = 351
2 × 108 = 216
1 × 110 = 110
----------------------------------------
677
∴ MAweight = 677/6 ≅ 113 units.
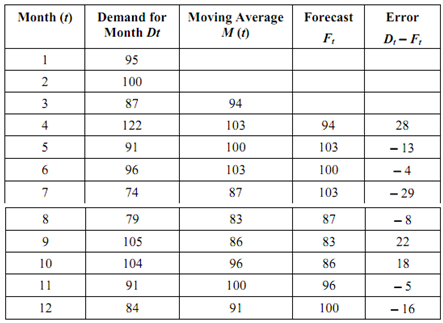
Let us take another instance. The actual demand for trailors for the months of year 2000 are shown in Table. The moving average may be calculated by averaging the first n items of data into a single number (where n is the number of items of data to be averaged). The grouping is then incremented by one data-item. The three-month moving average for third to the last month is shown in the third column, while forecasts for the fourth month and subsequent months are depicted in 4th column. The difference of actual demand and forecast demand is shown in the last column.
For selecting the value of n, it must be kept in mind that the larger the value of n, the greater the dampening or smoothing effect. A large n shall show the entire trend but can obliterate seasonal cycles. Alternatively, smaller n has very little smoothing effect and the moving average tends to resemble the original data.
Table: Three Months Moving Averages
The ratio of actual demand in a given period to the moving average demand for the same period is known as the specific seasonal index. Its value determines the seasonal effect and some random influences of the period for which it is calculated. By averaging the values of the specific seasonal index for the same period in successive years the remaining random influence may be smoothened out, and thus seasonal effects can be isolated.