Sample range chart - control charts for variables, Operation Management

Assignment Help:

Sample Range Chart - Control Charts for Variables

Whilst the sample mean chart provides control over the process setting, it provides no protection from change (increase) in the standard deviation of the process output. The second control chart (shown here) provides this by means of control limits set out from the average sample range (¯R) , determined when the process was stable.

663_sample range chart 1.png

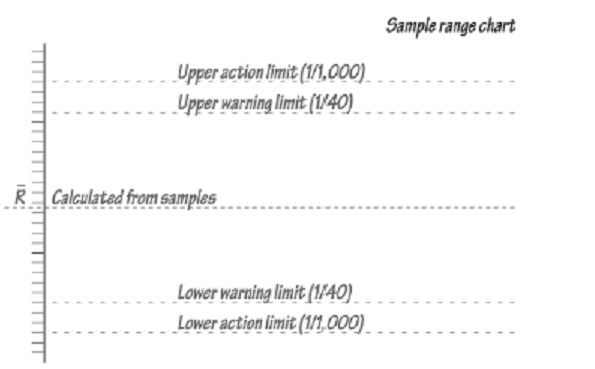
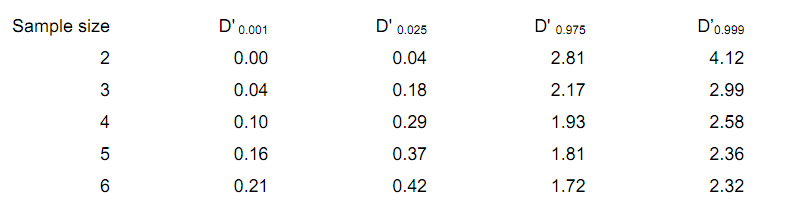
Again, the control limits are established as 1-in-40 warning and 1-in-1000 action limits. They are determined by multiplying the average sample range (¯R) by the appropriate D' coefficient from the table below.

Upper action limit = D'0.9999 ¯R

Upper warning limit = D'0.975 ¯R

Lower warning limit = D'0.025 ¯R

Lower action limit = D'0.001 ¯R

1434_sample range chart.png

In practice, the lower control limits are often omitted, the reasoning being that exceptionally low range values represent welcome consistency. However, such low-probability results are unlikely to be produced by a stable process, and may, in fact, be an indication that the measurements are incorrect.


Related Discussions:- Sample range chart - control charts for variables

Regal marine, Computer-Aided Design is one of the techniques used by Regal ...

Computer-Aided Design is one of the techniques used by Regal Marine in the manufacturing of boats. With the aid of examples, critically discuss FIVE (5) techniques that are import

Demerits of continuous or flow production, Demerits of Continuous or Flow P...

Demerits of Continuous or Flow Production The production problem which may arise particularly in high volume flow is that the constant repetition of a short time cycle task may

Explain successful personal selling philosophy, According to the Strategic/...

According to the Strategic/Consultative Selling Model, what are the three prescriptions for developing a successful personal selling philosophy?

Electronic data interchange, Electronic data interchange relies on   St...

Electronic data interchange relies on   Structured data and standard business documents.

Explain what are the objectives of work-center scheduling, 1) What are the ...

1) What are the objectives of work-center scheduling? 2) Distinguish between a job shop, aGT cell and a flow shop?

Number of defects - control chart, Number of Defects - Control Chart S...

Number of Defects - Control Chart Sometimes the attribute of concern is the number of defects (c) in an item rather than the number of defective items in a sample: for example

Disadvantages of observation methods, Disadvantages of Observation Methods:...

Disadvantages of Observation Methods: According to bailey the disadvantages in observation technique are: 1. Lack of Control: In artificial setting control over variable sis

Explain what is statistical process control, What is Statistical Process Co...

What is Statistical Process Control? What are the advantages and disadvantages of SPC? Identify two or three applications in your organization that could benefit from Statistical P

How team structure related to the project managers authority, How is the pr...

How is the project team structure related to the project manager's authority level?

Explain requirements of alliance membership, In what ways might the divisio...

In what ways might the divisionalized forms of most airlines lend themselves to the requirements of alliance membership? In what ways might they be compatible with the organization

Write Your Message!

Captcha
Free Assignment Quote

Assured A++ Grade

Get guaranteed satisfaction & time on delivery in every assignment order you paid with us! We ensure premium quality solution document along with free turntin report!

All rights reserved! Copyrights ©2019-2020 ExpertsMind IT Educational Pvt Ltd