Sample mean chart - control charts for variables, Operation Management

Assignment Help:

Sample Mean Chart - Control Charts for Variables

This figure depicts a typical means chart, on which sample means would be progressively plotted, left to right. Two sets of control limits have been drawn symmetrically about the process population mean (estimated as the grand mean of several samples). The inner pair, the upper and lower warning limits, are positioned ±1.96 standard errors (s) above and below the population mean. For a stable process, there is a 1 in 40 chance that a sample mean will exceed the upper warning limit, and likewise for the lower warning limit. The outer pair, the upper and lower action limits, are positioned ±3.09s above and below the population mean. Again, for a stable process, there is only a 1 in 1000 chance of a sample mean breaching the upper limit, and likewise for the lower limit. If we determine the ranges of several samples, we can compute the average sample range (¯R). Remembering that the standard error s = σ / √n, we can take advantage of the findings of a statistician, Hartley, who quantified the relationship: σ = ¯R/dn where dn is a coefficient which varies with sample size. Hartley's constants (dn), for sample sizes 2 to 6, are presented in this table.

2077_Sample Mean Chart - Control Charts for Variables.png

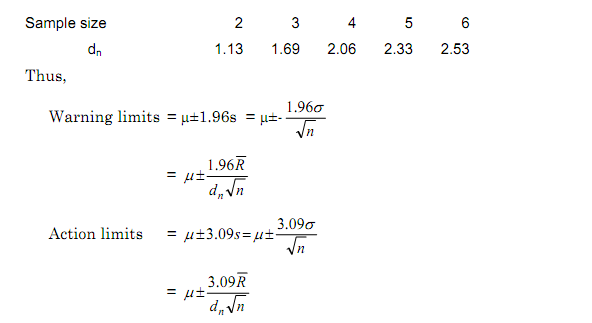
For convenience, the coefficients 1.96/dn √n and 3.09/dn √n have been calculated for a series of sample sizes. These values are presented as A' 0.025 and A' 0.001 in this table.

Sample size             A'0.025                A'0.001 

2                                  1.23                 1.94 

3                                  0.67                 1.05 

4                                  0.48                 0.75 

5                                  0.38                 0.59 

6                                   0.32                0.50

The final expressions are, therefore:

Warning limits = μ+A'0.025 ¯R

Action limits = μ+A'0.001 ¯R


Related Discussions:- Sample mean chart - control charts for variables

Explain service sector management economics, SSME is an acronym standing fo...

SSME is an acronym standing for "Service Sector Management Economics."

Patient safety or quality of care is not negatively impacte, Weekly tasks o...

Weekly tasks or assignments (Individual or Group Projects) will be due by Monday and late submissions will be assigned a late penalty in accordance with the late penalty policy fou

Explain cause organizations to redesign their products, What are some of th...

What are some of the factors that cause organizations to redesign their products or services?

Define construct a stem-and-leaf display, Use the data in Exhibit 16-5 to c...

Use the data in Exhibit 16-5 to construct a stem-and-leaf display

SWOT analysis of McDonald''s order process, Please help with SWOT analysis ...

Please help with SWOT analysis of Mcdonald''s ordering process

Explain employees accepting responsibility, The workplace is moving from ca...

The workplace is moving from career ladders to career tracks, with employees accepting responsibility for managing their own careers. Elaborate on this new phenomenon, discussing s

Explain democracy of goods, The concept of the "democracy of goods" means w...

The concept of the "democracy of goods" means what? 1. Fill in the blanks: By Mistake, someone left spaces unfilled in the status report below. a. Please complete the report

Explain the stage in the product life cycle labeled a, The stage in the pro...

The stage in the product life cycle labeled A in the below figure is called introduction. maturity. growth. diversification. decline.

Operation function, meaning of operation function in operation management

meaning of operation function in operation management

Explain what is the value creation frontier, 1.Why does each generic busine...

1.Why does each generic business model require a difficult set of business-level strategies? Give examples of pairs of companies in: (a) the computer industry; (b) the electronics

Write Your Message!

Captcha
Free Assignment Quote

Assured A++ Grade

Get guaranteed satisfaction & time on delivery in every assignment order you paid with us! We ensure premium quality solution document along with free turntin report!

All rights reserved! Copyrights ©2019-2020 ExpertsMind IT Educational Pvt Ltd