Risk breakdown structure (rbs) , Project Management

Assignment Help:

Risk Breakdown Structure (RBS) 

Risk Breakdown Structure (RBS) is a tool developed by Dr. David Hillson that is used to guide the risk management process. He describes RBS as "A Source-oriented grouping of project risks that organise and defines the total risk exposure of the project. Each descending level represents an increasingly detailed definition of sources of risk to the project." (Introduction to IT project management By Cynthia Snyder, Frank Parth).

The Risk Breakdown Structure (RBS) helps a project manager and the risk manager to structure the risks being identified. RBS is considered as the "hierarchically organized depiction of the identified project risks arranged by risk category." The risk data can be arranged in an organised and structured manner to provide standard presentation of the risk data, which help in better understanding, communication and management. 

Problem related to the structuring of project risk can be solved by using hierarchical approach with levels that are required to provide essential understanding of tracked risks for effective  risk management. This hierarchical structure of potential risk sources is known as a Risk Breakdown Structure (RBS). The RBS arranges the risk items into labelled rows and columns within a table called Matrix. This Risk Matrix is considered as tool used to determine the severity of the risk of an event. 

Risk Breakdown Structure (RBS) has proven to be the most useful method when compared to other methods such as listing and tracking risks in the spread-sheets. RBS helps you to have a better knowledge on addressed risks which in turn helps you to get into the depth of each risk. 

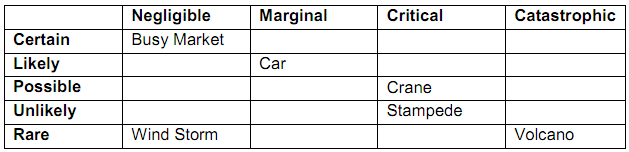
The Table 2.2 shows an example of how the risks are broken down into a matrix structure: 

Table 2.2: Matrix Structure   

1466_matrix structure.png

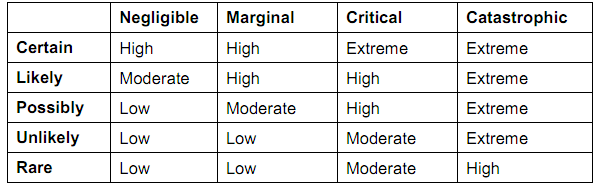
After arranging the tracked risk items in table as matrix form, the company then computes the levels of risk to take with different events. For example, you may face any kind of risks such as having a crane dropped on you, or hit by a car, or the risk of being caught in a stampede. Each risk has probability and a consequence. Probability of being hit by car is more when compared to the risk of being caught in a stampede. However, the consequence of the risk of being caught in a stampede is more terrifying than the risk of being hit by a car. The below Table 2.3 shows the possible risks with their probability and consequence: 

Table 2.3: Risk Probability and Consequence  

1402_matrix structure1.png


Related Discussions:- Risk breakdown structure (rbs)

NETWORK DIAGRAMS, AHOW TO FIND THE VARIANCE OF AN ACTIVITY AND THE THE PROB...

AHOW TO FIND THE VARIANCE OF AN ACTIVITY AND THE THE PROBABILTY THAT A WORK WILL BE FINISHED IN A GIVEN NUMBER OF DAYSsk question #Minimum 100 words accepted#

How is inventory control worked for an optimum balance, How is Inventory co...

How is Inventory control worked for an optimum balance between competing objectives? Inventory control is related with achieving an optimum balance in between two competing obj

What is a trade-off in the context of a project?, Question: a) ‘Changes...

Question: a) ‘Changes in the competitive environment in which majority of organisations operate has necessitated a major rethink of the ways in which projects are managed'(Harv

Product development cycle, The product development cycle starts with th...

The product development cycle starts with the assessment of the customers needs and ends when the design is finally released for bulk production. The main steps in th

WBS and Network diagram, Network Diagram for my course project based upon t...

Network Diagram for my course project based upon the WBS. The Network Diagram should include the Earliest Start (ES), Earliest Finish (EF), Latest Start (LS), Latest Finish (LF), a

Process planning, Process planning A process is any part of an organi...

Process planning A process is any part of an organization that takes inputs and transforms them into outputs. The value the process generates is the difference between what t

Sequence activities and milestones , This assignment is designed to demonst...

This assignment is designed to demonstrate your understanding of project scheduling, time and cost estimation. Assignment: Update your group's WBS created in Assignment 1

Nancy, explain the main typical data input errors that affect deliver of pr...

explain the main typical data input errors that affect deliver of project

Help on project from henley, The Integrated Management Project is a demandi...

The Integrated Management Project is a demanding piece of work requiring initiative, energy and application. It is our desire to support you and help you in this process as much as

Organization of material management, Organization of Material Management: ...

Organization of Material Management: To  facilitate  planning direction  control and co ordination of  various activities  related to material in an  enterprise  thee should

Write Your Message!

Captcha
Free Assignment Quote

Assured A++ Grade

Get guaranteed satisfaction & time on delivery in every assignment order you paid with us! We ensure premium quality solution document along with free turntin report!

All rights reserved! Copyrights ©2019-2020 ExpertsMind IT Educational Pvt Ltd