Risk breakdown structure for a project , Project Management

Assignment Help:

Risk Breakdown Structure for a Project 

Risk Breakdown Structure (RBS) is a hierarchical list of risks, which standardises the department's personnel resources that help in planning and controlling the project work. It also helps to identify and manage the project risks. 

In a project, which has more number of risks, you can define different risk breakdown structures for each separate task. Each risk is differentiated by its time of occurrence, chance of occurrence and outcome. This kind of project also has a number of risk templates, which are the standard set of risk breakdown structures that allow you to easily add risks to the projects. These kinds of templates are always included in the projects with more number of risks. You can also create your own template and use it in your project. The total resources make the Level 1 in the hierarchies, and each subsequent level makes sub-level of the resource category. Each lower level represents a detailed description of the resource, which helps plan, monitor and control the work.

Each project has its Risk Breakdown Structure (RBS). The RBS benefits the people engaged in risk identification process by reminding them of the possible risk areas to think about. It provides an input to Qualitative Risk. 

The Figure is the Risk Breakdown Structure for a generic project which explains each level with examples.  

934_Risk breakdown structure.png

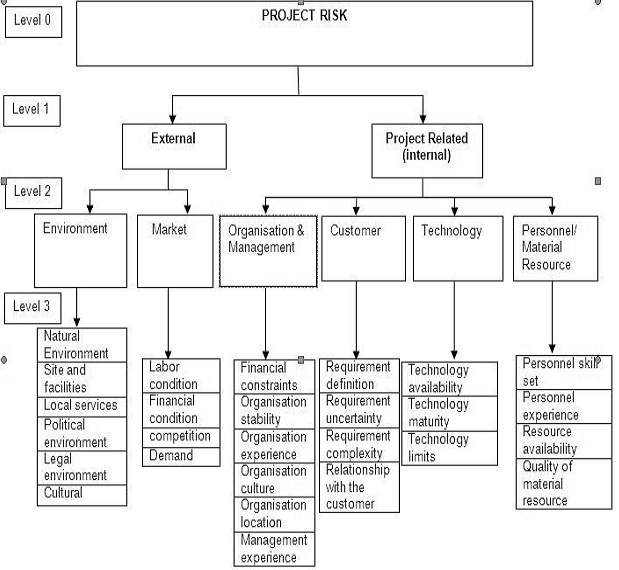
Figure : Risk Breakdown Structure for Generic Project 

Analysis of each risk can be done whereby impacts are assigned as numeric or as High, Medium and Low. Risks are then prioritised according to the affects it causes in the Project's success.  


Related Discussions:- Risk breakdown structure for a project

Explain about the term cost-benefit analyses, Explain about the term cost/b...

Explain about the term cost/benefit analyses. Cost/benefit analyse: Cost/benefit analysis is the procedure of knowing, and as far as probable quantifying, the costs of res

PMP, A good leader is not necessarily a good manager.” Discuss this stateme...

A good leader is not necessarily a good manager.” Discuss this statement & compare leadership With management.

Linear Programming Problem, Maximize Z= 3x1 + 2X2 Subject to the constraint...

Maximize Z= 3x1 + 2X2 Subject to the constraints: X1+ X2 = 4 X1 - X2 = 2 X1, X2 = 0

Contrast cost benefit analysis with investment appraisal, Question: (a)...

Question: (a) Describe cost benefit analysis as used to appraise large public sector investments. (b) Compare and contrast cost benefit analysis with investment appraisal.

Determine the point project lifecycle into the business case, At what point...

At what point into the project lifecycle must the business case be prepared? The short respond to this is ‘before any exact work has been completed and before main resources ar

Principles of success for the project manager, Principles of Success for th...

Principles of Success for the Project Manager Project  managers  always  hire  the  best  people  available  and  then  do whatever it takes to keep the project up and running.

Benefits and caveats, (a) What are the benefits and caveats of adopting a ...

(a) What are the benefits and caveats of adopting a standard methodology (such as PRINCE2) for the management of an organization's projects? (b) How might the size of an organi

Describe key characteristics of a matrix project structure, C Consultancy C...

C Consultancy Company gives management consultancy to a range of organisations.  It employs staff who have different industry backgrounds and who also offer different specialisms,

Explain portfolio management in project, Question: (a) Project plans ar...

Question: (a) Project plans are created in knowledge areas throughout the different phases of the project life cycle and are subsidiary components of the overall project manag

Operating characteristic curve, O perating characteristic curve The op...

O perating characteristic curve The operating characteristic curve for a sampling plan quantifies the risks. The OC curve for an attribute plan is a graph of the percentage de

Write Your Message!

Captcha
Free Assignment Quote

Assured A++ Grade

Get guaranteed satisfaction & time on delivery in every assignment order you paid with us! We ensure premium quality solution document along with free turntin report!

All rights reserved! Copyrights ©2019-2020 ExpertsMind IT Educational Pvt Ltd