Residual Method
We know that a time series consisting of annual data for longer periods is depicted by trend lines. This facilitates us to isolate the component of secular trend variation from the series and examine it for cyclical, seasonal and irregular components. In this part, we will look at "Residual Method", by which one can isolate the cyclical variation component. Further, this method can be bifurcated into two measures: Percent of Trend and Relative Cyclical Residual measures. Both these measures are expressed in terms of percentage. We look at each of them.
Percent of Trend Measure
When the ratio of actual values (Y) and the corresponding estimated values (  ) is multiplied by 100, we are expressing the cyclical variation component as a percent of trend. Mathematically, we express it as
((Y/  ) x 100)
When percent of trends are calculated and plotted on a graph, we can observe the variations from the trend line. Let us look at an example, which explains this method.
Relative Cyclical Residual Measure
In this measure, we take the ratio of the difference between the Y and the corresponding . .  values (that is, Y -
  ), and the
  values. To express these values in terms of percentage we multiply them by 100. In other words, the percentage deviation from the trend is found for all the values in the series. Mathematically, this is expressed as:
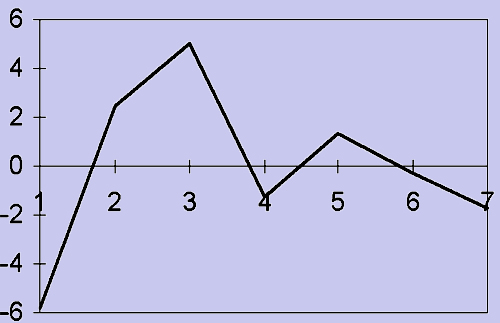
In the above example, the values of Relative Cyclical Residual are obtained when 100 is subtracted from the values given in column (7). The respective values are shown in column (8). The plot of Relative Cyclical Residual is shown below. A value of -5.81 indicates that the number of cartons of cereal sold by the Departmental Store has shown a decrease of 5.81% from its previous level.
Figure : Relative Cyclical Residual
