For the given function recognize the intervals where the function is increasing and decreasing and the intervals where the function is concave up & concave down. Utilizes this information to sketch the graph.
h ( x ) = 3x5 - 5x3 + 3
Solution
we are going to require the first two derivatives therefore let's get those first.
h′ ( x ) = 15x4 -15x2 = 15x2 ( x -1) ( x + 1)
h′′ ( x ) = 60x3 - 30x = 30x (2x2 -1)
Let's begin with the increasing/decreasing information .
For this function there are three critical points: x = -1 , x = 0 , and x = 1 . Below is the number line for the increasing/decreasing information.
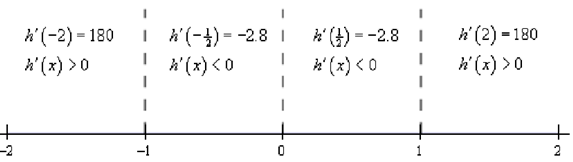
Thus, it looks like we've got the given intervals of increasing & decreasing.
Increasing: - ∞ < x < -1 and 1 < x < ∞
Decreasing: -1 < x < 0, 0 < x < 1
Note as well that from the first derivative test we can also say that x = -1 is a relative maximum & that x = 1 is a relative minimum. Also x = 0 is neither relative minimum nor maximum.
Now let's get the intervals where the function is concave up & concave down. If you think regarding it this procedure is almost identical to the procedure we use to recognize the intervals of increasing & decreasing. The only difference is that we will be using the second derivative rather than the first derivative.
The first thing that we have to do is recognize the possible inflection points. These will be where there the second derivative will be zero or doesn't present. The second derivative in this case is a polynomial and therefore will exist everywhere. It will be zero at the given points.
x = 0, x = ±1/√2 = ±0.7071
As with the increasing & decreasing part we can draw a number line up and utilizes these points to divide the number line in regions. Within these regions we know that the second derivative will always contain the similar sign as these three points are the only places where the function might change sign. Thus, all that we have to do is pick a point from each of region and plug it into the second derivative. Then the second derivative will have that sign within the whole region from which the point came from
Following is the number line for this second derivative.
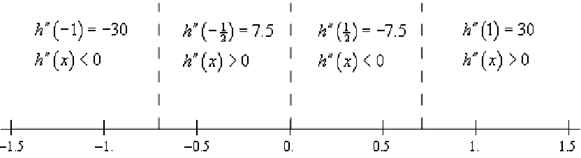
Therefore, it looks like we've got the given intervals of concavity.
Concave Up : - 1/√2 < x < 0 and 1/√2 < x < ∞
Concave Down :- ∞ < x < - 1/√2 and 0 < x < 1/√2
It also means that
x = 0, x = ±1/√2 = ±0.7071
are all inflection points.
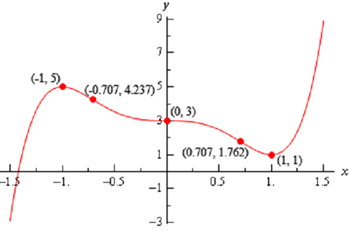
All these information can be a little overwhelming while going to sketch the graph. The first thing which we have to do is get some starting points. The critical points & inflection points are good starting points. Therefore, first graph these points. Now, begin to the left & begin graphing the increasing/decreasing information. As we graph this we will ensure that the concavity information matches up with what we're graphing.
By using all this information to sketch the graph gives the following graph.