R Chart
In this part we are going to look at control charts which are directed towards monitoring the variability in case of individual characteristics like the variability in the diameter of the pistons. This is based on the logic that less the variability in the products manufactured, more the consistency and hence higher the quality. In these charts, the time variable is represented on the X axis and the sample range on the Y axis. The center line is drawn at "  ". To draw the control limits we need to know about the standard deviation of the R distribution. Since the derivation of the equation for σR is beyond the scope of this book, we state the equation without going into its details. It is given by
where,
σ is the population standard deviation
d3 is a factor like d2, d3 also depends on the size of the sample 'n'.
d3 gives the relationship between the standard deviation of the population and the standard deviation of the range calculated from the samples. The values of d3 are also found in the table.
The lower and the upper control limits are calculated by the equations given below.
| Lower control limit |
= |
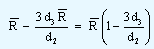 |
| Upper control limit |
= |
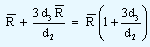 |
However this is made much more easier by denoting 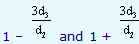 by D3 and D4 respectively. The values of D3 and D4can be found in the tables. At this point it would be worthwhile to note that the lower control limit as given by the equation would be zero if the value of "n" that is the sample size is equal to or lower than 6. This is precisely the reason why we will find the values of D3 for n ≤ 6 as zeros in the tables. Let us take the example of Piston India Ltd. We know that is 0.39 and d2 = 2.704. The value of d3 for a sample size of 7 is 0.833. Substituting all these values in the control limits, we have
| Lower control limit |
= |
 |
|
=
|
0.39 - |
 |
= 0.39 - 0.36 = 0.03
| Upper control limit |
= |
 |
|
=
|
0.39 + |
 |
|
=
|
0.39 + 0.36 = 0.75 |
R chart for this data is shown below.
Figure
From the chart, we conclude that the process variability is well within the limits. Since these charts utilize range which is the difference between the highest and the lowest values it leaves out other observations present in the data and therefore may not reflect the amount of variation.