Quality control
Quality control uses techniques and performs activities to compare actual quality performance with requirements and define appropriate actions if there is a quality variance. Improving quality is the goal of quality control Quality control also monitors project performance with respect to scope, budget and schedule. The features of quality control include:
Acceptance: The service or product delivered is either accepted or rejected by the beneficiaries, donor and stakeholders.
Rework: It is the action taken to make a rejected product or service comply to stakeholders expectations
Adjustments: This is done to correct or take necessary steps to avoid future quality problems or defects based on quality control measurements.
There are seven basic quality control tools that are used to for quality control. Pareto charts, check sheet, cause and effect diagram (also called Ishikawa diagram), histogram, scatter diagram, flow chart and control charts are the tools used to control quality.
A Pareto diagram is a unique category of bar diagram that displays the relative frequency of several problems or actions. This is a popular quality control tool and is used to highlight the most common source of defect. It shows the essential causes and assists in choosing the development efforts that are necessary to solve the problem on sequential basis.
Check sheet also called a tally sheet, helps to collect data in real-time and is collected for a qualitative or quantitative recording of information. It is easy, quick and efficient to record data using this method.
Cause and effect analysis is also known as Fish Bone or Ishikawa diagram. This diagram shows the association between various events, and is a valuable analysis in developing ideas and in discovering the root cause of any problem. The name fish bone has been coined since it fairly looks like a skeleton of a fish and provides detailed display of the relationship with major bone in the centre. Example of Fish Bone Diagram for solving problem of "Wobbling" in a Machine tool.
In the example given, all the causes that may contribute to the „Wobbling? of a machine element, which is rotating, are listed in the Fish bone diagram below:
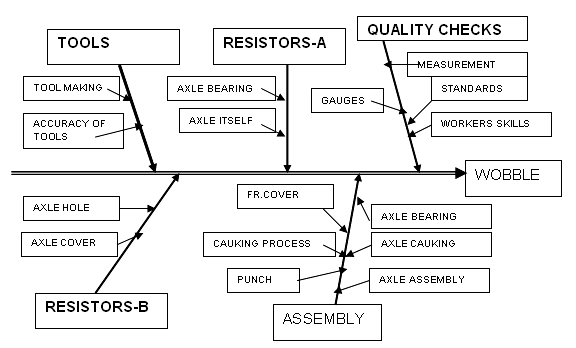
Figure: Fish Bone diagram
Histograms show a visual summary of the data, which is simple to understand. When the data given is of various varieties, it is difficult to understand and interpret and histograms provide an easy way to do so.
Scatter diagram through a scatter plot helps in suggesting the correlations between variables .In a scatter diagram two sets of corresponding data are plotted. The relation between them is plotted as dots demonstrating the relationships between the corresponding data.
A flow chart is a graphical representation that displays and describes the process in a sequential flow of operations.
Control charts are process behaviour charts that show if a performance of a process (manufacturing or business) is totally under a state of control. Control charts facilitate to discover unusual trends with the help of line graphs. These graphs differ from regular line graphs. They have control limit lines at the middle, top and bottom levels. Sample data are drawn in dotted lines on the graph to estimate process situation and developments.