PROPERTIES
1. The value of standard deviation remains the same if, in a series each of the observation is increased or decreased by a constant quantity. In statistical language, we say standard deviation is independent of change of origin.
For example, for the observations 3, 10 and 12 then μ = 8.33 and σ= 3.859.
If we increase the value of each observation by 4.5, we get the observations 7.5, 14.5 and 16.5.
Now, μ = 12.833 and σ = 3.859
Hence although μ has increased by 4.5, σ remains the same.
2. For a given series, if each observation is multiplied or divided by a constant quantity, standard deviation will also be similarly affected.
Consider the observations 3, 10, 12. σ = 3.859 as shown in the above calculation.
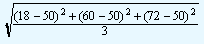
Suppose we multiply each observation by 6, the observations become 18, 60 and 72.
μ = 50
|
σ
|
= |
 |
| |
= |
23.152 |
Which is nothing but the earlier σ , 3.859 x 6.
In short, standard deviation is independent of any change of origin, but dependent on the change of scale.
3. Standard deviation is the minimum root-mean-square deviation. In other words, the sum of the squares of the deviations of items of any series from a value other than the arithmetic mean would always be greater.
4. Just as it is possible to compute combined mean of two or more groups, it is also possible to compute combined standard deviation of two or more groups. Combined standard deviation denoted by σ12 is computed as follows:
|
σ12
|
= |
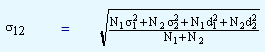 |
where,
|
μ1
|
= |
Mean of first group |
|
μ2
|
= |
Mean of second group |
|
σ1
|
= |
Standard deviation of first group |
|
σ2
|
= |
Standard deviation of second group |
|
N1
|
= |
Number of observations in the first group |
|
N2
|
= |
Number of observations in the second group |
|
d1
|
= |
μ1 - μ |
|
d2
|
= |
μ2 - μ |
|
μ
|
= (N1 |
μ1 |
+ N2 |
μ2 |
) / (N1 + N2) |