PRODUCTION POSSIBILITY CURVE
As we have seen, the essence of economic analysis is the problem of scarcity and choice. We know that limited productive resources compel individuals, economic units and economies to choose certain ends. This can be explained by a simple diagrammatic presentation of the problem of choice.
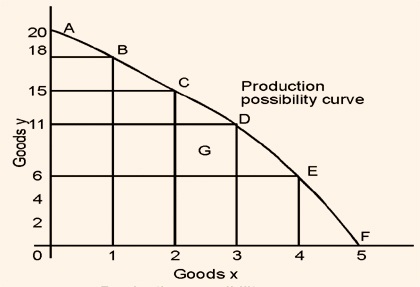
Let us start with an economy with a given set of resources such as land, technical know-how, industries, tools and labor. A production possibility curve indicates the various combinations of two classes of goods that an economy can produce when its resources are fully employed. Though no economy in the world produces only two classes of goods, this brings forth the significance of what an economic choice implies. We can divide an economy's output into output for domestic consumption and output for exports, output of goods and output of services, output by the public sector and output by the private business sector, output of consumption goods and output of capital goods, output of labor-intensive goods and output of capital intensive goods and so on. However, for the purpose of illustration, we shall simply classify the output into two classes of goods as goods X and goods Y. Figure A1.1 shows a typical production possibility curve - also known as production frontier or transformation function.
Production Possibilities
|
Possible situation
|
Good X
|
Good Y
|
|
1
|
0
|
20
|
|
2
|
1
|
18
|
|
3
|
2
|
15
|
|
4
|
3
|
11
|
|
5
|
4
|
6
|
|
6
|
5
|
0
|
This curve shows the possibilities open for increasing the output of one class of goods by reducing the output of another. In the diagram, all the productive resources are assumed to be limited so that if they are all devoted to the production of X an amount Xmax could be produced. If they are all devoted to Y an amount of Ymax could be produced. Alternatively, by 'mixing' the allocation of resources to X and Y we can have various combinations of these two goods. Points A, B, C, D, E, F are points of full employment whereas at point G there are unemployed resources. The production possibility curve is drawn concave to the origin because, although resources have alternative uses, they are not equally efficient in all uses. In fact as more and more of one class of goods is produced, resources which are less and less suited to the production of that class of goods will be used. As a result, any given input resources will lead to a smaller and smaller rise in total output. This is indicated in the changing production possibilities along the curve
Production Possibility Curve