Production Functions, Labor Markets, and a Small Open Economy. In 2007, the Icelandic economy was in general equilibrium, the supply of labor was
a positive function of the real wage, and the supply of capital was fixed.
b. Based only on this information, use a Production Function diagram (on the left) and a Labor Market diagram (on the right) to clearly and
accurately show Iceland's initial (1) level of economic output, (2) employment, and (3) the real wage rate. These diagrams should be drawn in
BLACK.
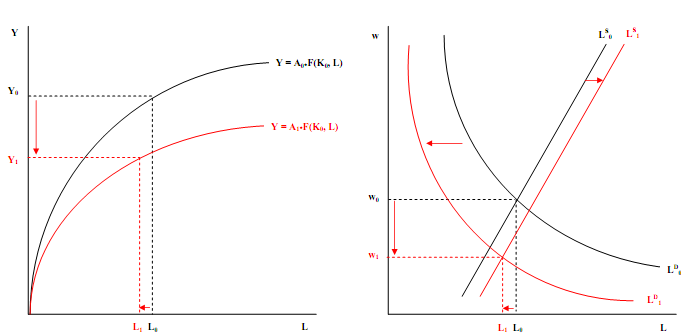
Because the economy was initially in general equilibrium, the labor market was also in equilibrium where the quantity of labor demanded was exactly equal to the quantity of labor supplied at an equilibrium real wage rate of w0. With the equilibrium real wage at w0, equilibrium employment was L0. With equilibrium employment at L0, equilibrium economic output was given by the production function at Y0.
In 2008, Iceland suffered a major financial crisis which led to a sharp decline in expected future income. Based only on this additional information, clearly and accurately show the effects of the financial crisis on Iceland's (1) level of economic output, (2) employment, and (3) real wage rate on your diagrams above. These effects should be drawn in RED.