Product transformation curve, Microeconomics

Assignment Help:

Production:

- Firms should choose how much of each to produce.

- The alternative quantities can be illustrated by using product transformation curves.

Product Transformation Curve
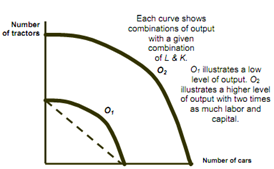
900_product transformation curve.png

* Observations

- Product transformation curves are sloped negatively

- Constant returns are there in this example

- As the production transformation curve is concave is joint production desirable?

- There is no direct relationship between economies of scope and economies of scale.

- May experience diseconomies of scale and economies of scope.

- May have the economies of scale and don't have economies of scope. 

* The degree of economies of scope measures savings in cost and can be given as:

1236_product transformation curve1.png

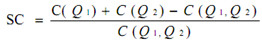
- C(Q1) is cost of producing Q1

- C(Q2) is cost of producing Q2

- C(Q1Q2) is joint cost of producing both products

* Interpretation:

- If SC > 0 -- Economies of scope

- If SC < 0 -- Diseconomies of scope

* Issues

- Truckload versus less than truck load

- Direct versus indirect routing

- Length of haul 


Related Discussions:- Product transformation curve

Estimating Industry Demand for Fresh Market Carrots, this is a project I ne...

this is a project I need help answering the questions

Indifferentces curve, using the tools of an indifference curve and isoquent...

using the tools of an indifference curve and isoquent, highlight on consumption and production in business economics.

Determinants of investments, Determinants of investments: Expected Ra...

Determinants of investments: Expected Rate of Return: Investment spending is guided by the profit motive; thebusiness sector buys capital goods only when it expects such

TOTAL REVENUE AVERAGE REVENUE AND MARGINAL REVENUE, CASE STUDY IN RELATION ...

CASE STUDY IN RELATION WITH TOTAL REVENUE,AVERAGE REVENUE AND MARGINAL REVENUE

Demand and supply, technological advance reduced the cost of computer chips...

technological advance reduced the cost of computer chips . explain using the demand and supply diagrams , how the the following markkets are affected in terms of price and quantiti

TRENDS and Composition, discuss the trend and composition of national incom...

discuss the trend and composition of national income and per capital income

The state of confidence in conventional judgements, The State of Confidence...

The State of Confidence in Conventional Judgements : While individuals fall back on conventions to guide their behaviour in the face of uncertainty, they are also aware that th

Accompanying table , The accompanying table represents the price and yearly...

The accompanying table represents the price and yearly quantity sold of ice cream cones on Sidfield Island.   Price of Ice Cream Cones Quantity of Ice Cr

Write Your Message!

Captcha
Free Assignment Quote

Assured A++ Grade

Get guaranteed satisfaction & time on delivery in every assignment order you paid with us! We ensure premium quality solution document along with free turntin report!

All rights reserved! Copyrights ©2019-2020 ExpertsMind IT Educational Pvt Ltd