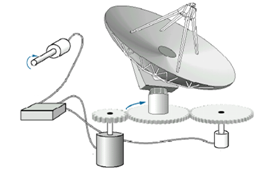
An antenna shown in Figure is to be adjusted from its current position to a new desired position by turning a potentiometer at an angle θi(t). The potentiometer converts the angular displacement into voltage. Another potentiometer is used to convert the angular position of the antenna into voltage which then serves as a feedback system. The difference between the voltage outputs from the two potentiometers is amplified in two stages to supply an appropriate voltage level to a motor driving the antenna. The system normally operates to drive the error to zero i.e. when the input and output voltages (produced through the potentiometers) are equal, the error will be zero and consequently the motor receives no voltage and halts to drive the antenna. In this control process, apply the six (6) steps to model and analyse the given system by which the following items shall be subsequently produced.
a) Block diagram
b) Schematic diagram
c) Simplified diagram
d) The transfer function of the system θ0(S)/θt(S)
e) The plots of the system responses while working on the design analysis.
f) Discussion on the following cases:
i. If the gear diameter attached to the antenna is increased, what is the effect on the system response and why?
ii. If the system is ensured to be always stable and that the steady-state error is kept at zero, what are the appropriate measures?
iii. If strong wind strikes unequally across the face of the antenna plate, how will it affect the response of the system? What is the appropriate method to overcome a problem it creates?
Note: for the above three cases, prove your explanation and illustration with appropriate evidences in terms of numerical values and plots.
Section 2
Design a compensator such that the step response of the system yields the following changes:
1. The percent overshoot shall be reduced by 50%
2. The settling time shall be reduced to 3.0 sec.
Note: Should you not be able to satisfy the given specification with one type of controller, you may use other type. Any particular technique in the design procedures is left for you to decide. You must produce all the evidences of your work in the form of numerical values and plots.
Parameter Name V a l ue
Differential Amplifier gain : 2
Power amplifier Gain : 100
Power amplifier frequency shift : 50
Armature Resistance : 10 k_
Rotor Inertia : 0.03 kg-m2
Rotor damping : 0.02 N.m s/rad
Load Inertia : 4 kg-m2
Load damping : 2 N.m s/rad
Back emf constant : 1 V.s/rad
Motor Torque Constant : 1 N.m/A
Gear 1 number of Teeth : 40
Gear 2 number of Teeth : 200
Gear 3 number of Teeth : 250
Input Potentiometer Gain : 2.0
Output potentiometer Gain : 1.5