Process technology life cycle , Operation Management

Assignment Help:

Process Technology Life Cycle

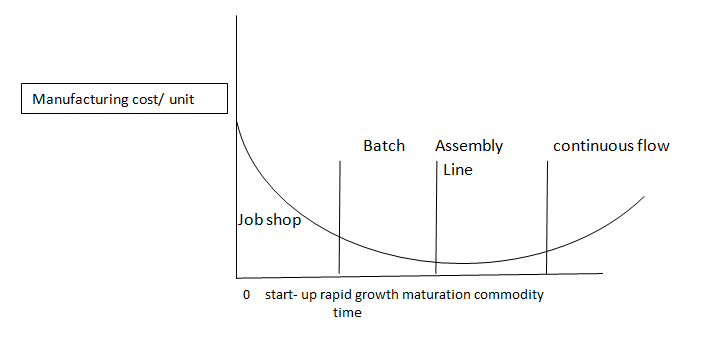
Process technologies have life cycles related to product life cycles as shown in figure below. Over time unit manufacturing costs diminish for mature products. Form product start up to decline, manufacturing processes change in organization throughput volume, rates of process innovation,  and automation. To illustrate the process technology is typically job shop at start up and moves toward a continuous flow technology if the product survives to become a commodity. Throughput volumes and automation are low at start up and high during maturation and decline. These changes require appropriately matching up the manufacturing product and process structures.

698_Process Technology Life Cycle.png

Typical combinations of product process structures are shown in figure below. Representative industries are listed on the diagonal of the matrix, and the voided corners indicate product process combinations that are incompatible and infeasible. Most companies divisions or plants can be located.

2421_Process Technology Life Cycle 1.png

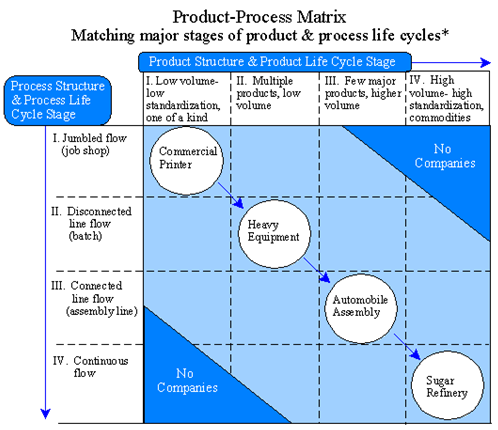
                                  Figure: Matching Major Stages of Product and Process Life Cycle -The Product Process matrix.

On the matrix, depending upon the current life cycle stage of their  dominant product line. As the product shifts to a different stage, the manufacturing process structure also shifts, and new manufacturing priorities emerge. Whereas manufacturing flexibility and quality are competitive priorities in earlier stages, priorities shifts toward dependable delivery and competitive cost in later stages.

This product process matrix helps us understand why and how companies change their production operations. As products, market requirements and competition change so must equipment procedures, and human resources. If process changes are not made to accommodate product life cycles product and process are incompatible: the result is competitive disadvantage.


Related Discussions:- Process technology life cycle

Explain step of customer needs and expectations, Beginning with the step of...

Beginning with the step of customer needs and expectations (expected quality), identify and describe the remaining steps in the customer-driven quality life cycle. (Hint: drawing a

Define the minimal long-term effect on the environment, Define the minimal ...

Define the minimal long-term effect on the environment. Practices for minimal continuing effect onto the environment: a. Reduction within the use of toxic substances. b.

Operation Management, Six Operators are to be assigned to five jobs with th...

Six Operators are to be assigned to five jobs with the cost of assignment in Rs. given 10 marks in the matrix below. Determine the optimal assignment. Which operator will have no a

Explain team communication systems, What are some of the possible biases an...

What are some of the possible biases and points of error that may arise in team communication systems? Use relevant research and citations. Please provide relevant work or project

Rationalize your compensation as well benefits package, Rationalize your co...

Rationalize your compensation and benefits package. Be sure to indicate the research and considerations that went into the design of the compensation and benefits package.

Define goal is to develop a strong talent management program, The goal is t...

The goal is to develop a strong talent management program globally to develop and retain talent that you have been losing to competitors. Discuss the strategies that you might use

Develop a management research, You have been approached by the editor of Ge...

You have been approached by the editor of Gentlemen's Magazine to carry out a research study. The magazine has been unsuccessful in attracting show manufacturers as advertisers. Wh

Explain asset has negative risk, Suppose rf is 5% and rM is 10%. According ...

Suppose rf is 5% and rM is 10%. According to the SML and the CAPM, an asset with a beta of -2.0 has a required return of negative 5% [= 5 - 2(10 - 5)]. Can this be possible? Does t

Sample mean chart - control charts for variables, Sample Mean Chart - Contr...

Sample Mean Chart - Control Charts for Variables This figure depicts a typical means chart, on which sample means would be progressively plotted, left to right. Two sets of c

Write Your Message!

Captcha
Free Assignment Quote

Assured A++ Grade

Get guaranteed satisfaction & time on delivery in every assignment order you paid with us! We ensure premium quality solution document along with free turntin report!

All rights reserved! Copyrights ©2019-2020 ExpertsMind IT Educational Pvt Ltd