Problems in using arc elasticity, Managerial Economics

Assignment Help:

The use of arc elasticity in economic analysis involves a good deal of chariness since it is capable of being misinterpreted. Arc elasticity coefficients vary between the same two finite points on a demand curve if direction of change in price is reversed. Arc elasticity for a decrease in price would be different from that for same increase in price between the same to points on a demand curve. For instance, the price elasticity between points J and K - moving from J to K - is equal to 1.11. This is the elasticity for decrease in price from 25$ to 10$. Though a reverse movement on the demand curve, which is from point K to J implies an increase in price from 10$ to 25$ that will give a different elasticity coefficient. In the case of movement from point K to J, P = 10, Δ P = 10 - 25 = - 15, Q = 50 and ΔQ = 50 - 30 = 20. Substituting these values in elasticity formula, we get

EP = (20/-15)(10/50) = 0.26

Measure of arc elasticity co-efficient in equation I for the reverse movement in price is obviously different from the one given in equation II. So, while measuring the arc elasticity, direction of price change must be carefully noted, otherwise it may yield misleading conclusions.

A method recommended to resolve this problem is to use average of lower and upper values of P and Q in fraction, P/Q, so that formula is

Ep = (δQ/δP). {(P1+P2)/2} / {(Q1+Q2)/2}

   = (Q1-Q2/P1-P2). {(P1+P2)/2} / {(Q1+Q2)/2}

Substituting the values from this illustration, we get

= (30-50/25-10). {(10+25)/2} / {(30+50)/2} = 0.58

This method has its own disadvantages as elasticity co-efficient calculated through this formula, refers to elasticity of demand at mid-point between points J and K (Fig. below). Elasticity co-efficient (0.58) isn't applicable for the whole range of price-quantity combinations at different points between J and K on the demand curve (Fig. below). It gives only mean of the elasticity between the two points. It is vital to note that elasticity between mid-point and the upper point J or lower point K will be different. So this method doesn't give one measure of elasticity.

672_Problems in Using Arc Elasticity.png

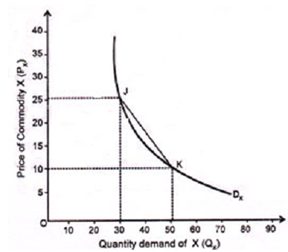
Figure: Measuring Arc Elasticity


Related Discussions:- Problems in using arc elasticity

Controlover supply of inputs - sources of monopoly, Q. Controlover Supply o...

Q. Controlover Supply of Inputs - sources of monopoly? Furthermore, a monopoly situation may arise because of control over the supply of an essential input -skilled labour, raw

Historical development of money, The Historical development of money F...

The Historical development of money For the early forms of money, the intrinsic value of the commodities provided the basis for general acceptability :  For instance, corn, s

Factors influencing supply curve - goals of the firm, Goals of the firm ...

Goals of the firm How much is produced by a firm depends on its objectives.  A firm which aims to maximise its sales revenue, for example, will generally supply a greater quant

#title.total revenue, if Q=120-2p is the equation for demand curve, find th...

if Q=120-2p is the equation for demand curve, find the compounding total, marginal and average revenue function

Monopoly, features of monopoly?

features of monopoly?

Demand-pull inflation, Demand-pull inflation is when aggregate demand exce...

Demand-pull inflation is when aggregate demand exceeds the value of output (measured in constant prices) at full employment.  The excess demand of goods and services cannot be met

Marginal revenue (mr), Marginal Revenue (MR) This is the increase in T...

Marginal Revenue (MR) This is the increase in Total Revenue resulting from the sale of an extra unit of output.  Thus, if TR n-1 is Total Revenue from the sale of (n-1) units

Explain about frequency domain, Q. Explain about Frequency domain? Fre...

Q. Explain about Frequency domain? Frequency domain:   Frequency domain is a term which is used to elucidate the domain for analysis of mathematical signals or functions with

Simon satisfying behaviour model, Q. Simon satisfying behaviour model? ...

Q. Simon satisfying behaviour model? The behavioural approach as developed in particular by Richard Cyert and James G. March of the Carnegie School, lays emphasis on explaining

Write Your Message!

Captcha
Free Assignment Quote

Assured A++ Grade

Get guaranteed satisfaction & time on delivery in every assignment order you paid with us! We ensure premium quality solution document along with free turntin report!

All rights reserved! Copyrights ©2019-2020 ExpertsMind IT Educational Pvt Ltd