PROBABILITY AND EXPECTED UTILITY
Most students know the elementary combinatorial rules for probability algebra and need only a refresher with some exam- ples. We have used card examples; you can easily construct similar ones with coins or dice.
The concept of risk aversion is simple at an intuitive level, but its treatment using expected utility can be difficult to get across. We have found it useful to involve the students. Take a particular utility function, say the logarithmic, and calculate the sure prospect that gives the same utility as the expected utility of a particular lottery. The logarithmic utility function is shown in the diagram below, with payoffs on the vertical axis representing the log of the dollar amount on the horizontal axis:
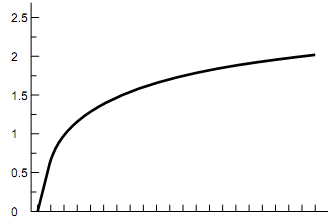
In this case, U(10) = 1 and U(100) = 2. One possible lottery to consider might be that in which there is a 50-50 chance of getting 10 or 100 (55 on average). With risk aversion, U(0.5 ´ 10 + 0.5 ´ 100) = 1.74 > 0.5 ´ U(10) + 0.5 ´ U(100). Rather, 0.5 ´ U(10) + 0.5 ´ U(100) = 1.5 = U(31.6). Thus, $31.60 gives the same amount of utility as the 50-50 lottery between $10 and $100 under this utility function. Now ask for a vote on how many students would accept the sure prospect ($31.60) and how many the lottery (50% chance of $10 and 50% chance of $100). If a majority would accept the sure prospect, say, "Most of you seem more risk- averse than this. Let us try a more concave function, say U(x) = -1/x" and repeat the experiment. You can use this process to try to find the risk aversion of the median student.
A few students get sufficiently intrigued by this to want more. If your class gets interested, and if you have time, you can talk about the history of the subject (St. Petersburg para- dox and all that) or about the recent work in psychology and economic theory on non-expected-utility approaches. For a discussion of the St. Petersburg paradox, or consider using the following simple example of the Allais paradox that can help students see that they do not always make choices consistent with maximizing their expected utility.
Describe first a choice between two lotteries: Lottery A pays $3,000 with probability 1 and Lottery B pays $0 with probability 0.2 and $4,000 with probability 0.8. Ask stu- dents to choose which lottery they would prefer to enter at a price of zero (and ask them to make note of their choices). Most choose A over B. Then describe a choice between two different lotteries: Lottery C pays $0 with probability 0.8 and
$4,000 with probability 0.2; Lottery D pays $0 with proba- bility 0.75 and $3,000 with probability 0.25. Again ask students to pick. Most choose C over D.
Now consider how the paired choices fit with the idea that people maximize expected utility. Set U(0) = 0. For those who chose A and C, this implies that EU(A) > EU(B) or that 1U(3,000) > 0.8U(4,000); but choosing C implies that EU(C) > EU(D) or that 0.2U(4,000) > 0.25U(3,000). The latter is equivalent to 0.8U(4,000) > 1U(3,000). This is in direct contradiction to the implication made when choos- ing A over B. Similar calculations can be used to show that those who choose B and D also violate the expected utility hypothesis. The choices of both A and D, or both B and C are consistent with maximization of expected utility.