Price elasticity of supply, Microeconomics

Assignment Help:

Price elasticity of supply

– Computes the percentage change in quantity supplied resulting from a 1 percent variation in price.

– The elasticity is usually positive as price and quantity supplied are directly associated.

We can refer to elasticity of supply with regard to interest rates, wage rates, and the cost of raw materials.

1917_price elasticity of supply.png

  • Recall

2085_price elasticity of supply1.png

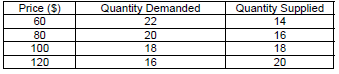
  • Elasticity of demand when price = $80 is

 Ep = 80/20 x -2/20 = -0.40

  • Elasticity of demand when price = $100 is

 Ep = 100/18 x -2/20 = -0.56

  • Elasticity of supply when price = $80 is

 Ep = 80/16 x 2/20 = 0.50

  • Elasticity of supply when price = $100 is

 Ep = 100/18 x 2/20 = 0.56

  • The Market for Wheat

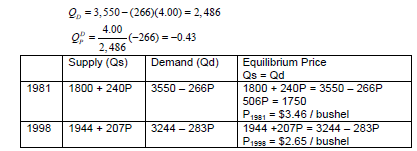
– 1981 Supply Curve for Wheat

– QS = 1,800 + 240P

– 1981 Demand Curve for Wheat

– QD = 3,550 - 266P

– Equilibrium: Q S = Q D


1,800 + 240P = 3,550 - 266P

506P = 1,750

 P = 3.46/ bushel

 Q = 1,800 + (240)(3.46) = 2,630 million bushels

2045_price elasticity of supply2.png

– Suppose the price of wheat is $4.00/bushel

366_price elasticity of supply3.png


Related Discussions:- Price elasticity of supply

Partial input elasticity of output, Partial Input Elasticity of Output:   ...

Partial Input Elasticity of Output:   This is a short-run concept which deals with the variability of only one factor keeping the others constant. There are three kinds of retu

Explain the generalised least square procedure, (a) What is  meant by heter...

(a) What is  meant by heteroscedasticity and what are the consequences of applying OLS estimation in its presence? (b) Explain in details the Generalised least Square procedure

Fixed exchange rate system, FIXED EXCHANGE RATE SYSTEM: National curre...

FIXED EXCHANGE RATE SYSTEM: National currencies are generally acceptable within the geographical boundaries of a country. As such, trade between countries typically involves

Macro ecomomics, explain how macro and micro issues may be represented usin...

explain how macro and micro issues may be represented using production possibility curve

Trend projection methods, An ole firm can use its own data of past years re...

An ole firm can use its own data of past years regarding its sales in past years. These data are known as time series of sales. A firm can predict sales of its product by fitting t

Determinants of demand for education, Normal 0 false false ...

Normal 0 false false false EN-IN X-NONE X-NONE MicrosoftInternetExplorer4

Mr and ar, A monopolist''s demand curve is P=100-2q. find his MR function. ...

A monopolist''s demand curve is P=100-2q. find his MR function. at what price is MR zero

Emergence and persistence of structural imbalances, Emergence and Persisten...

Emergence and Persistence of Structural Imbalances: The period broadly corresponds to the period of the Sixth Plan and the Seventh Plan. The Sixth Plan was launched when the e

Write Your Message!

Captcha
Free Assignment Quote

Assured A++ Grade

Get guaranteed satisfaction & time on delivery in every assignment order you paid with us! We ensure premium quality solution document along with free turntin report!

All rights reserved! Copyrights ©2019-2020 ExpertsMind IT Educational Pvt Ltd