Melting and freezing points:
When a pure solid substance is heated through its melting point (melting temperature), the solid changes to a liquid. At the melting point equilibrium is established between the solid and liquid phases. Conversely, when a liquid is cooled through its freezing point or freezing temperature, the liquid is transformed to a solid, and at the freezing point, equilibrium is established so the melting and freezing temperatures of a pure substance are identical and in this case the terms can be used interchangeably.
Boiling point:
At the boiling point of a liquid A, equilibrium is established for the transition of A between liquid and vapor:

Again, the equation  can be applied to this equilibrium, but in this case with the changes in volume and entropy being ΔV=V(g)-V(1) and ΔS=S(g)-S(1), for the transformation between liquid and vapor. ΔS have a positive value, as substances have more freedom of movement in the vapor than in the liquid. ΔV is always positive and is much larger than that observed in a melting transition.
Phase diagrams of a single species:
The boiling equilibrium condition is represented as a line on a plot of the pressure, p against the temperature, T (Fig. 1). In this plot, this condition can be represented as a line of positive gradient, so that any points on this line correspond to the situation where vapor and liquid are at equilibrium.
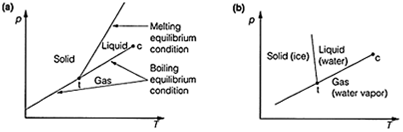
Fig. 1. Pressure-temperature plot (phase diagrams) resulting from plotting the boiling point and melting point equilibrium condition lines. (a) Normal plot; (b) plot for water.
Especially when applied to multi-component (multisubstance) systems (see Topic D5), is the number of degree of freedom, F, of the system. This is the minimum number of variables that can be varied without changing the number of phases in the system. F=2 for the regions where liquid, gas or solid only are present, as changes in two variables (for example p and T) are possible without a phase change occurring. This corresponds to being able to move in two directions on the phase diagram (Fig. 2a). On the freezing point or the melting point lines, F=1, as movement in one direction, down and up the line only, is possible in order to maintain the two phases at equilibrium. That means there is only one independent variable,
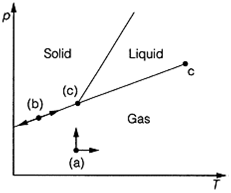
Fig. 2. The concept of the number of degrees of freedom, F, as applied to movement on a phase diagram. (a) F=2; (b) F=1; (c) F=0. as the two variables are related by the equation of the line (Fig. 2b). At the triple point, which occurs at one fixed point on the diagram, no movement is possible and F=0 (Fig.2c).