Passing structures to functions, MATLAB in Engineering

Assignment Help:

Passing Structures to Functions:

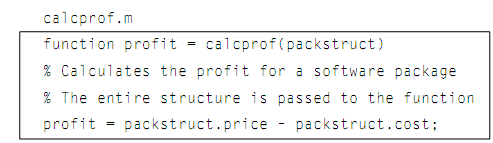
The whole structure can be passed to a function, or separate fields can be passed. For illustration, here are the two distinct versions of a function which computes the profit on a software package. The profit is then defined as the price minus the cost.

In the first version, the whole structure variable is passed to the function, therefore the function should use the dot operator to refer to the price and cost fields of the input argument.

653_Passing Structures to Functions.png

>> calcprof(package)

ans =

19.9600

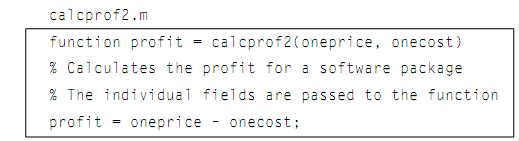
In the second version, merely the price and cost fields are passed to the function by using the dot operator in the function call. These are passed to the two scalar input arguments in function header; therefore there is no reference to a structure variable in the function itself, and the dot operator is not required in the function.

2117_Passing Structures to Functions1.png

>> calcprof2(package.price, package.cost)

ans =

19.9600


It is significant, as always with the functions, to make sure that the arguments in the function call correspond one-to-one with the input arguments in the function header. In case of calcprof, the structure variable is passed to an input argument that is a structure. For second function calcprof2, the two individual fields, that is double values, and is passed to two double arguments.


Related Discussions:- Passing structures to functions

Intersect function and setdiff function, Intersect function and setdiff fun...

Intersect function and setdiff function: The intersect function rather than returns all the values which can be found in both of the input argument vectors. >> intersect(v

Executing a program - modular program, Executing a program: Running th...

Executing a program: Running the program would be completed by typing the name of the script; this would call the other functions: >> calcandprintarea Whenever prompt

Streamslice, I have a 400x2 vel.dat and 20x2 xy.dat file, how can i plot a ...

I have a 400x2 vel.dat and 20x2 xy.dat file, how can i plot a streamslice graph on matlab with this two files.

Vector operations, Vector operations: As vectors are special cases of ...

Vector operations: As vectors are special cases of matrices, the matrix operations elaborated (addition, subtraction, multiplication, scalar multiplication, transpose) work on

Example of interpolation and extrapolation, Example of Interpolation and ex...

Example of Interpolation and extrapolation: The MATLAB has a function to do this, known as polyfit. The function polyfit finds the coefficients of the polynomial of the partic

Use of while loop, Use of While loop: Here is an illustration of calli...

Use of While loop: Here is an illustration of calling the function, passing 5000 for the value of the input argument high. >> factgthigh(5000) ans = 5040 The itera

Example of file ploting data, Example of file ploting data: As the oth...

Example of file ploting data: As the other example, a data file called 'compsales.dat' stores the sales figures (in millions) for divisions in a company. Each line in the f

Execution steps - modular program, Execution steps: Whenever the progr...

Execution steps: Whenever the program is executed, the steps below will take place: The script calcandprintarea starts executing. The calcandprintarea calls the readr

Illustration of gauss elimination, Illustration of Gauss elimination: ...

Illustration of Gauss elimination: For illustration, for a 2 × 2 system, an augmented matrix be: Then, the EROs is applied to obtain the augmented matrix into an upper

Write Your Message!

Captcha
Free Assignment Quote

Assured A++ Grade

Get guaranteed satisfaction & time on delivery in every assignment order you paid with us! We ensure premium quality solution document along with free turntin report!

All rights reserved! Copyrights ©2019-2020 ExpertsMind IT Educational Pvt Ltd