P Chart
As against the  and R charts which deal with quantitative aspects, these charts deal with the attributes which are qualitative factors possessed by the data. An example would be a person being a major or a minor or the marital status of the person. In these examples, we note that a person is either a major or not, similarly a person is either married or not. That is we are looking at whether the given data set is in confirmation with the given qualitatitive factor or not. The answer would be an emphatic yes or no and either a success or a failure. There is no neutral state of acceptance. In statistical process control, the data set which can take on only two values is called an attribute. From this point of view, it can be said that the quality of the product conforms to the specified standards or it does not. Since we take into account the attributes of the given data set, the measure we will employ is the proportion of the data points satisfying the given criteria and the proportion of the data points that does not satisfy the criteria. With respect to this, let us recollect that the probability of success in the binomial distribution is denoted by "p" and the proportion of units that have a particular characteristic in a given population is symbolized by "p" and the same in a sample is denoted as
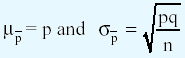
  . Remember that using the binomial distribution to form interval estimates of a population proportion would be tedious and as the sample size increases the binomial distribution can be approximated by a normal distribution and therefore the number of successes are converted to the proportion of success by dividing np by n. Since np gives us the mean of the binomial distribution, the mean of the sampling distribution is given by np/n = p. q is used to denote the probability of failure and the proportion of units that do not show the characteristic under consideration. The standard deviation is also obtained on similar lines. That is, the mean and the standard deviation of the sampling distribution of the proportion are given by
|
|
With the fractional values of p and the center line at  , we plot the p chart. The control limits are given by
In case we do not know the p value, we estimate it by using the overall sample fractions. The mathematical expression for the same is shown below.

where
 is the sample fraction in the j th interval of time
k is the sum of all the samples considered.
Therefore in the equations given above to calculate lower and upper control limits, p should be replaced by  .
.
An important point to note is that if the value of LCL is below zero, we take the value of LCL as zero and if the value of UCL exceeds 1, it is considered as 1. Do you find any similarity between this concept and the concept of probability? Yes. If you recollect, the classical probability defines probability as the ratio of number of the outcomes where that particular event occurs to the number of all the possible outcomes. From this definition we can see the relationship between probability and the proportion of the units satisfying a particular characteristic out of all the units manufactured.
Then from the plot we identify the pattern and if required the corrective action is taken.