Example: Order Quantity and Reorder Point:
Daily demand for a particular product manufactured by ABC company is distributed normally with a mean of 30 and standard deviation of 5. The source of supply is reliable and maintains a constant lead time of 6 days. The expense of placing the order is Rs. 8.5 and annual holding cost is Rs. 0.75 per unit. There is no stock out costs, and unfilled orders are filled as soon as the order arrives. Consider sales occur over the whole 365 days of the year. Determine the order quantity and reorder point to satisfy a 95 per cent probability of not stocking out throughout the lead time.
Solution
For this problem, we shall first calculate the order quantity Q as well as the reorder point R. Given data are
d' = 30 S = Rs. 8.5 σ d = 5 H = Rs. 0.75 D = 30 (365) L = 6
The optimal order quantity is

For calculating the reorder point, we ought to calculate the amount of product used during the lead time and add this to the safety stock.
The standard deviation of demand throughout the lead time of six days is computed from the variance of the individual days. As each day's demand is independent

Since, z is 1.64,
R = d'L + z σL = 30 (6) + 1.64 (12.2474) = 200.0857 units
To sum up the policy derived in this instance, an order for 498 units is placed whenever the number of units remaining in inventory drops to 200 units.
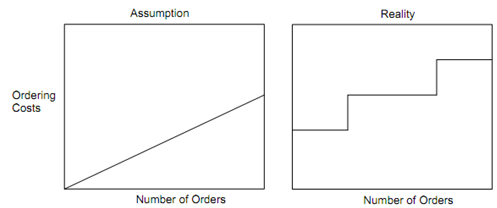
Attaining actual order, setup, carrying and shortage costs is hard. For instance, Figure compares the ordering costs that are supposed linear to the real case where every addition of a staff person causes a step enhanced in cost. Mostly inventory systems are affected by two major problems viz. maintaining sufficient control over each inventory item, and ensuring that accurate records of stock on hand are kept.

Figure: Cost to Place Orders Versus the Number of Orders Placed : Linear Assumption and Normal Reality