1. How much variation is there in the routine analysis of fibre content of soya cotton cakes? The data are presented by the lab that did the test and the technician within the lab that did the analysis.
(Data from Clarke and Kempson)
To perform an appropriate analysis, you will need 3 columns, one for the responses, one indicating the lab and one indicating the technician. When specifying your model, remember that technicians are nested within labs (so you could number the technicians from 1 to 9 if you wanted). Write down the two null hypotheses. Check whether or not the assumption of normality is justified. Give a 2 or 3 sentence summary of your conclusions.

2. Commercial respirators include filters to protect against particulate matter. There are two manufacturers of such filters and three filters were selected at random from each manufacturer. Each filter was tested three times. \The measurements are the percent penetration by a standard type of aerosol." (from Kuehl, including data)

(a) Using these data , write down the appropriate linear model.
(b) Compute the analysis of variance table, including the expected mean squares.
(c) Check for normality.
(d) As the assumption of normality is not satisfied, replace the responses by their ranks and repeat
the analysis on the ranks. Have your conclusions changed?
(e) Write a 1 or 2 sentence summary of your conclusions.
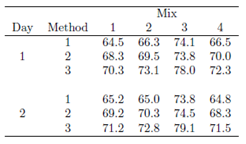
3. Montgomery (2007) describes an experiment to study pigment dispersion in paint. Four mixes of a pigment are used. Each day all four mixes are prepared and then applied to three panels with each panel receiving paint by one of three application methods (brush, roller, spray gun). The experiment is repeated on a second day. Perform an appropriate analysis and comment. (Hint: consider the paper tensile strength example.)
