Grouped Data
In order to find the median, the median class is to be first located and then interpolation is to be used by assuming that items are evenly spaced over the entire class interval. The formula used for the calculation of median is
Median = 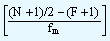 W + Lm
Where,
Lm = Lower limit of the median class
fm = Frequency of the median class
F = Cumulative frequency up to the lower limit of the median class
W = Width of the class interval
N = Total frequency.
Example
Let us find median for the following data.
|
Gross profit as a percentage of sales
|
0-10
|
10-20
|
20-30
|
30-40
|
40-50
|
|
No. of companies
|
21
|
32
|
43
|
34
|
23
|
|
Gross profit
(%)
|
No. of Companies
(f)
|
Cumulative Frequency
(cf)
|
|
0-10
|
21
|
21
|
|
10-20
|
32
|
53
|
|
20-30
|
43
|
96
|
|
30-40
|
34
|
130
|
|
40-50
|
23
|
153
|
Here the total frequency N = 153. Median is the size of the  th item, i.e.
 th item, i.e. the size of the 77th item. It lies in the class 20-30. Hence 20-30 is the median class, of which the lower limit is 20.
Thus, Lm = 20, N = 153, F = 53, fm = 43, W =10
Median
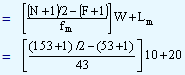
= 25.34
Thus 25.34 is the median gross profit percentage of the companies.