Economies and Diseconomies of Scale
-Economies of Scale
- Increase in the output is greater than increase in the inputs.
-Diseconomies of Scale
- Increase in the output is less than increase in the inputs.
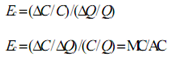
Measuring Economies of Scale
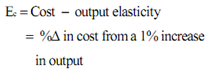
Thus, the following is true:
-EC< 1: MC < AC
- Average cost shows decreasing economies of scale
-EC = 1: MC = AC
- Average cost shows constant economies of scale
-EC > 1: MC > AC
- Average cost shows increasing economies of scale
The Relationship between Short Run and Long Run Cost
-We will use long and short run cost to determine optimal plant size
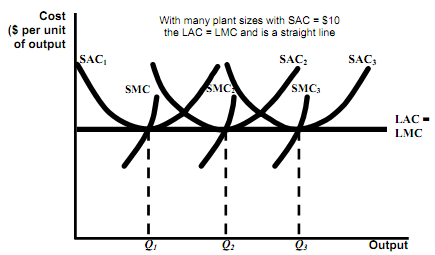
Long-Run Cost with the Constant Returns to Scale
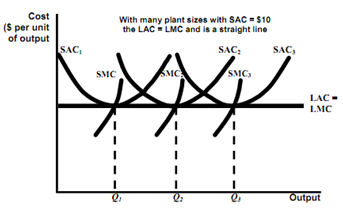
Observation
-The optimal plant size depends on the anticipated output (for example Q1 choose SAC1,etc).
-The long run average cost curve is the envelope of the firm's short run average cost curves.
Question
-What would happen to the average cost if an output level other than that shown is selected?
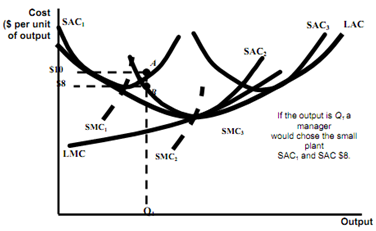
Long Run Cost(LRC) with Economies and Diseconomies of Scale
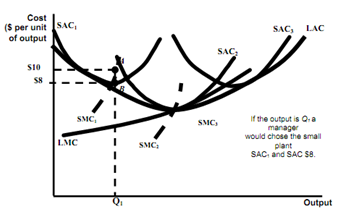
What is firms' long run cost curve?
-Firms can change scale to change output in the long-run.
-The long run cost curve is dark blue portion of SAC curve which represents minimum cost for any level of output.
Observations
-The LAC doesn't include minimum points of small and large size plants? Why not?
-LMC is not envelope of short run marginal cost. Why not?
Measuring Economies of Scale
* Thus, the following is true:
- EC< 1: MC < AC
- Average cost signifies decreasing economies of scale
- EC = 1: MC = AC
- Average cost signifies constant economies of scale
- EC > 1: MC > AC
- Average cost signifies increasing economies of scale
* The Relationship Between Short Run and Long Run Cost
- We will use long and short run cost to determine optimal plant size
Long Run Cost with the Constant Returns to Scale
* Observation
- The optimal plant size depends on the anticipated output (for example Q1 choose SAC1,etc).
- The long run average cost curve is the envelope of the firm's short run average cost curves.
* Question
- What would happen to the average cost if an output level other than that shown is selected?
Long Run Cost (LRC) with Economies and Diseconomies of Scale