Measures Of Skewness
- These are numerical values such assist in evaluating the degree of deviation of a frequency distribution from the general distribution.
- Given are the normally used measures of skewness.
1. Coefficient Skewness
= 3 * {(mean - median)/standard deviation}
2. Coefficient of skewness
= (mean - median)/standard deviation
NB: These 2 coefficients above are also termed as Pearsonian measures of skewness.
1. Quartile Coefficient of skewness
= (Q3 + Q1 - 2Q2)/(Q3 + Q1)
Whereas: Q1 = 1st quartile
Q2 = 2nd quartile
Q3 = 3rd quartile
NB: The Pearsonian coefficients of skewness generally range between -ve (negative) 3 and +ve (positive) 3. These are extreme value that is +ve (positive) 3 and -ve(negative) 3 which hence indicate that a given frequency is negatively skewed and the amount of skewness is quite high.
Correspondingly if the coefficient of skewness is +ve or positive it can be concluded that the amount of skewness of deviation from the general distribution is quite high and the degree of frequency distribution also is positively skewed.
Illustration
The given information was acquired from an NGO which was providing small loans to some small scale business enterprises in year 1996 the loans are in the form of thousands of Kshs.
|
Loans
|
Units (f)
|
Midpoints(x)
|
x-a=d
|
d/c= u
|
fu
|
Fu2
|
UCB
|
cf
|
|
46 - 50
|
32
|
48
|
-15
|
-3
|
-96
|
288
|
50.5
|
32
|
|
51 - 55
|
62
|
53
|
-10
|
-2
|
-124
|
248
|
55.5
|
94
|
|
56 - 60
|
97
|
58
|
-5
|
-1
|
-97
|
97
|
60.5
|
191
|
|
61 -65
|
120
|
63 (A)
|
0
|
0
|
0
|
0
|
0
|
0
|
|
66 -70
|
92
|
68
|
5
|
+1
|
92
|
92
|
70.5
|
403
|
|
71 -75
|
83
|
73
|
10
|
+2
|
166
|
332
|
75.5
|
486
|
|
76 - 80
|
52
|
78
|
15
|
+3
|
156
|
468
|
80.5
|
538
|
|
81 - 85
|
40
|
83
|
20
|
+4
|
160
|
640
|
85.5
|
57.8
|
|
86 - 90
|
21
|
88
|
25
|
+5
|
105
|
525
|
90.5
|
599
|
|
91 - 95
|
11
|
93
|
30
|
+6
|
66
|
396
|
95.5
|
610
|
|
Total
|
610
|
|
|
|
428
|
3086
|
|
|
Required
By using the Pearsonian measure of skewness, estimate the coefficients of skewness and thus comment briefly on the nature of the distribution of the loans.
Arithmetic mean = Assumed mean +
= 63 + {(428 * 5)/610}
= 66.51
This is very significant to note that the method of acquiring arithmetic mean or any other statistic by misusing assumed mean (A) from X and then dividing by c can be a bit confusing, if this is the case then just employ the straight forward method of:
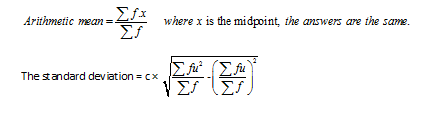
=5 × 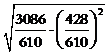
= 10.68
The Position of the median lies m = (n + 1)/2
= (610 + 1)/2= 305.5
= 60.5 + {(305.5 - 191 )/120} × 5
= 60.5 + (114.4/120) × 5
Median = 65.27
Hence the Pearsonian coefficient
= 3 * {(66.51 - 64.27)/10.68}
= 0.348