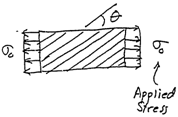
a) Determine the value of σ0 to cause failure when θ=30°, according to the maximum stress failure criterion. Consider both σ0 > 0 and σ0 < 0. Also, specify the nature of the expected failure modes for each case (e.g. "failure in longitudinal tension").
b) Make a computer-generated plot of the failure stress σ0,ult as a function of θ for the range 0 < θ < 90°. Use the maximum stress failure criterion and assume σ0 > 0. .
You may use MATLAB, Excel or any other package capable of making graphs.
The formatting and aesthetics of the graph(s) will count as a significant part of the scoring.
Plot at least 90 data points, and connecting the computed values with straight lines. Do NOT use Excel's "smooth curve" feature or similar functions. Also, turn off all "curve symbols" (the circles, squares, etc that identify individual computed points.
The only labeled numbers on the x-axis must be [0,15,30,45,60,75 and 90] (no not accept computer defaults -force these to be the numbers that are labled).
Include a hand-written explanation of your work showing equations used and how they are manipulated.
