Marginal utility approach, Managerial Economics

Assignment Help:

Marginal utility approach

The downward sloping nature of the demand curve can be explained by using the law of diminishing marginal utility.  For instance, consider a consumer who ahs to choose between two goods, X and Y, which have prices Px and Py respectively.  Assume that the individual is rational and so wishes to maximise total utility subject to the size of the income.

The consumer will be maximising total utility when his or her income has been allocated in such a way that utility to be derived from the consumption of one extra shillings worth of X is equal to the utility to be derived from the consumption of one extra shillings worth of Y.  In other words, when the marginal utility per shilling of X is equal to the marginal utility per shilling of Y.  Only when this is true will it not be possible to increase total utility by switching expenditure from one good to another.  This condition for consumer equilibrium can be written as follows:

                        Mux = Muy

                          Px     Py

Where MUx and MUy are the marginal utilities of X and Y respectively and Px and Py are the

prices (in shillings) of X and Y respectively.

Any number of commodities may then be added to the equation. The table below gives hypothetical marginal utility figures for a consumer who wishes to distribute expenditure of K£44 between three commodities X, Y and Z.

Marginal utilities derived from each Kg of:

Kg consumed

x (£8/kg)

Y (£4/kg)

Z (£2/kg)

1

2

3

4

5

6

7


72

48

40

36

32

20

12

60

44

32

24

20

8

4

64

56

40

28

16

12

8

In order to maximize utility, the consumer must distribute available income so that:

1886_marginal utility.png

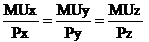
From the table you can see that this yields, a selection where the consumer buys 2 kg of X, 4 kg of Y and 6 kg of Z.  Hence:

210_marginal utility1.png

If the consumer wishes to spend all the K£44, it is impossible to distribute it any other way which would yield greater total quality.  This theorem is called the concept of equi-marginal utilities.


Related Discussions:- Marginal utility approach

Stabex, STABEX The STABEX scheme was designed to stabilize earnings fr...

STABEX The STABEX scheme was designed to stabilize earnings from exports of the African, Caribbean and Pacific (ACP) countries to the Community.  It covered seventeen agricult

Structural unemployment, Structural unemployment    Caused by structura...

Structural unemployment    Caused by structural changes such that there exist: Cyclical unemployment : During depression, prices are too low and profit margins remain d

What do you understand by equilibrium national income, a) What do you unde...

a) What do you understand by equilibrium National Income and to what extent is economic growth beneficial to an economy? b) Explain using both diagrams and mathematical tools,

Help w/ Question, You have opened your own word processing service. You hav...

You have opened your own word processing service. You have already bought a special computer needed for word processing and paid $5,000 for it. However, due to the cost changes in

Direct action, Direct Action Direct action in more than one from has be...

Direct Action Direct action in more than one from has been employed by the central banks either as an alternative to their discount rate policy or open market operations or tog

Keynesian view on unemployment, KEYNESIAN VIEW ON UNEMPLOYMENT   Keynes...

KEYNESIAN VIEW ON UNEMPLOYMENT   Keynes  in his General Theory presented  a view  that  fluctuations in  aggregate demand (AD) influences the equilibrium level of output. Thus

Fixed exchange rate, Country A has a fixed exchange rate with country B. Du...

Country A has a fixed exchange rate with country B. Due to a recession in country B, demand for A's goods falls. Draw what would happen on the graph below. On the graphs, draw what

The individual and market demand curves, The individual and market demand c...

The individual and market demand curves The quantities and prices in the demand schedule can be plotted on a graph. Such a graph after the individual demand schedule is called

Location problem in the plane, Location problem in the plane: In Kent, ...

Location problem in the plane: In Kent, the council to respond to the people and government needs, it decided to establish 3 community care homes. The towns are recorded with t

Write Your Message!

Captcha
Free Assignment Quote

Assured A++ Grade

Get guaranteed satisfaction & time on delivery in every assignment order you paid with us! We ensure premium quality solution document along with free turntin report!

All rights reserved! Copyrights ©2019-2020 ExpertsMind IT Educational Pvt Ltd