The return on investment has been aptly about as a primary ratio as it gives the relative net profit earned on the capital utilized. It is one particular measure where the last outcome of all business activities gets recorded. This gives not only a vehicle for measuring relative business effectiveness but also focuses attention on if an sufficient return has been earned in accordance along with the expectations of the investors on the capital contributed through them.
In several cases it becomes essential to disaggregate an organization in divisions and the return on divisional investment can be utilized to gauge the divisional performance. Nevertheless, this may be stated that the concept of ROI that is Return on Investment is not free from ambiguity. It is primarily due to the fact that denominator and numerator of this ratio that is "return" and "capital" are subject to opposite interpretations. As standard definitions of these two fundamental terms do not exist as still, the firms describe the terms as per to their own thinking. Whereas some firms may describe "investment" quite largely, others may describe it narrowly. As a result of this, variations of Return on Investment are found in "practice", for illustration ROA that is Return on Assets.
You will understand these variations better as you go with the conversation and the demonstrations regarding the analysis of ROI.
You may notice that the utilization of Return on Assets that actually is a combination of some other ratios was pioneered through Du point. That's why this is sometimes termed as the Du point system of financial control.
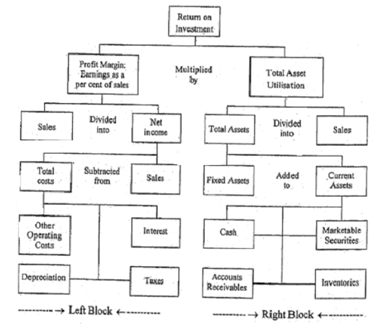
The Du point chart is presented in the figure 1 and this may be of interest to you to notice the manner wherein the various key components converge in a particular measure, that is: the Return on Investment: The right block charts out the investment created in different assets and the left block depicts the earnings and costs flowing in and out of the utilization of such assets. Both the total assets and net income are then associated to sales to finally yield the particular measure, that peaks the pyramid namely: the ROI.
You will see that Cash, Accounts Receivable, Marketable Securities and Inventories demonstrated on the right block at the bottom are added up like current assets that then are added as leftward to fixed, assets. Such aggregates in total assets that are then divided or rightward in sales to generate a ratio demonstrated as Total Asset Utilization or Total Assets Turnover. A same kind of measure depends on income emerges by the left block. The bottom 4 boxes on left sum up Interest Taxes, reduction and other operating costs in Total Costs that are then deducted as rightward from Sales to yield Net Income: The Net Income is divided or leftward in sales to make, a ratio termed as the Net Margin. The two penultimate measures are: Total Asset Utilization and Net Margin are after that multiplied together to figure out the Return on Investment on the top box of the chart.

The return on investment may be shows as relations in the subsequent formula as:
ROI = Total Asset Turnover X Net Margin
Or Net Income /Total Assets = Sales/Total Assets * Net Income/ Total Sales
You may then see that total assets may be financed partly through owners' funds termed as equity and partly through borrowed funds recognized as debt. Provided the proportion of assets financed through equity, a suitable measure of ROE that is Return on Equity might also be derived by the ROI. It will be given as:
ROE = ROI/Proportion of Total Assets financed by Equity
= ROI/((Equity)/(Total Assets))
= ROI * ((Total Assets)/(Equity))
The term Total Assets / Equity may be recognized as Equity Multiplier and then ROE will be equal to ROI times the Equity Multiplier.