LM-curve in the AS-AD model, Macroeconomics

Assignment Help:

The LM-curve in the AS-AD model 

The LM-curve will shift upwards (downward) when P is increases (decreases)

in the AS-AD model is moved

LM-curve in the AS-AD model is slightly more complicated as P will affect the demand for money. In IS-LM model, LM-curve is defined as all combination of R and Y where money market is in equilibrium, that is, where demand for money is equal to supply of money, MD(Y, R) = MS

In AS-AD model, LM-curve demonstrates all combinations of R and Y, where money market is in equilibrium for a given P. For a given P, we may still draw LM curve in the AS-AD model just as we did in IS-LM model. For a given P, there are numerous combinations of R and Y where money market is in equilibrium. Besides for another given P, another set of combinations of R and Y would be associated with equilibrium in the money market. It means that LM-curve will shift when P changes. 

2351_LM-curve in the AS-AD model.png

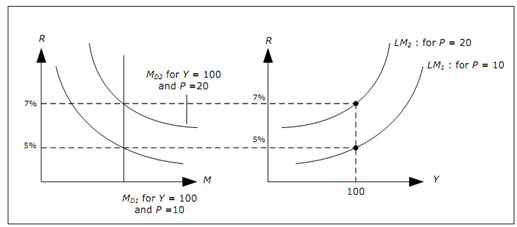
Figure: Money market diagram with different prices

1. First consider top left figure. Demand curve for money, MD1 is drawn for Y = 100 and P = 10. Equilibrium interest rate is R = 5%. 

2. Y = 100 and R = 5% will provide us with a point on the LM1 curve to the right. 

3. Now assume that P increases to 20. We know that demand for money will increase and curve will shift to the right (to MD2). 

4. We see that R = 5% and Y = 100 is no longer an equilibrium in money market. 

5. To the left you see that R = 7% would be an equilibrium when Y = 100 for P = 20. 

6. R = 7% and Y = 100 should be on a new LM curve (LM2) associated with higher price P = 20. 

There is an LM curve for P = 10 (LM1) and an LM curve for P = 20 (LM2). The significant thing to remember is that in AS-AD model, there is one LM-curve for each value of P. When P increases, LM curve will shift to a new curve that will be above the old one. Reason, again, is that R should increase when P increases to keep the money market in equilibrium.


Related Discussions:- LM-curve in the AS-AD model

Types of taxes and laffer curve, Types of Taxes Which a Government can impo...

Types of Taxes Which a Government can impose on the citizens are as follows: With the theory of taxation covered, we can now move towards the actual menu of the taxes the gover

How we can determine the macroeconomic performance, Macroeconomic performan...

Macroeconomic performance The UK's future macroeconomic performance must be judged on how average living standards improve, inflation is kept under control, economy grows and

Unions, Are unions “harmful monopolies” or "necessary?" compare and contras...

Are unions “harmful monopolies” or "necessary?" compare and contrast the schools of thought that subscribe and their point of views?

Supply and Demand, During the 1990s, technological advance reduced the cost...

During the 1990s, technological advance reduced the cost of computer chips. Explain, with the use supply and demand diagrams, how the following markets are affected in terms of pr

How to calculate the total income of the economy, Consider an economy that ...

Consider an economy that having only of those who bake bread and those who make its ingredients. Assume that this economy's production is as follows: 1 million loaves of bread

Calculate the kernel estimator and plot histograms, We will look now at cha...

We will look now at changes in the income distribution of Canadians between 1991 and 2001. Use the census data for these years provided in the course web page. Download that data i

Money supply, does central bank determine money supply in the economy

does central bank determine money supply in the economy

Feds actions on gdp impact, Suppose the banking system has reserves of $750...

Suppose the banking system has reserves of $750,000, demand deposits of $2,500,000 and a reserve requirement of 20%. a) If the Fed now purchases $125,000 worth of government bon

Explain the philips curve, Problem: Describe whether, the given stateme...

Problem: Describe whether, the given statements (a-f) are True, False or Uncertain. Briefly justify our answer. Questions (g) - (h) show all your calculations. No marks will be

The aggregate demand curve, The aggregate demand curve shows the combinatio...

The aggregate demand curve shows the combinations of the price level and the level of output at which the goods and money markets are simultaneously in equilibrium. Let us now go o

Write Your Message!

Captcha
Free Assignment Quote

Assured A++ Grade

Get guaranteed satisfaction & time on delivery in every assignment order you paid with us! We ensure premium quality solution document along with free turntin report!

All rights reserved! Copyrights ©2019-2020 ExpertsMind IT Educational Pvt Ltd