Linear approximation method for interpolation, Mathematics

Assignment Help:

Linear Approximation Method

This is a rough and ready method of interpolation and is best used when the series moves in predicted intervals. It can be applied to interpolate values in both ascending and descending series. The method can be best described with the help of illustrations.

Example 

The sales in units of a consumer durable are ascertained as follows:

Year

1986

1987

1988

1990

Sales Units (in '000s)

8

16

24

40 

The records of sales for the year 1989 were accidentally lost in a fire. The sales in this year could be interpolated by the following procedure:

  1. Use the value of the immediately preceding year as the base value or starting value. We may connote this as base value.

The year immediately preceding 1989, is 1988. Hence 24,000 units sold in 1988 is the base value.

  1. Ascertain whether the series is an ascending one or a descending one.

In the illustration, since demand for the units is steadily increasing, we may conclude that it is an ascending series.

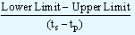
  1. Find out the difference in values of the variable corresponding to the immediately succeeding and preceding years of the year for which the value is to be interpolated. We may connote this as upper limit minus lower limit.

         Value corresponding to the immediately succeeding year (1990) = 40,000 units

         Value corresponding to the immediately preceding year (1988) = 24,000 units

         Upper limit - Lower limit               = 40,000 - 24,000

                                                       = 16,000

  1. Find out the time interval between the two known values. We may denote this as ts - tp.

         In the above illustration, the time interval between 1988 and 1990 is 2 years.

  1. Find out the time interval between the immediately preceding year and the year for which the value is to be interpolated. We may denote this as ti - tp.

         Time interval between 1988 and 1989 is one year.

  1. Interpolate the value as follows:

         For the illustration, the sales for the year 1989 will be,

24000 +

1008_linear approximatio method.png  x 1

         = 24,000 + 8,000 = 32,000

If the series is a descending series, the formula will be,

Base Value -   1116_linear approximation method1.png  x (ti - tp)              

Related Discussions:- Linear approximation method for interpolation

Find the equation to the pair of lines - coordinate geometry, 1. Find the n...

1. Find the number of zeroes of the polynomial y = f(x) whose graph is given in figure. 2 Find the circumcentre of the triangle whose vertices are (-2, -3), (-1, 0) and (7,-6).

The ratio of boys to girls at the dance was 3:4, The ratio of boys to girls...

The ratio of boys to girls at the dance was 3:4. There were 60 girls at the dance. How many boys were at the dance? Use a proportion comparing boys to girls at the dance. Boys/

Expertes, how to do multiplication

how to do multiplication

Sketch the exponental graph of f( x )=2x and g( x )= 1/2 , Example Sketc...

Example Sketch the graph of following f( x ) = 2x  and  g( x ) = ( 1 /2) x Solution Let's firstly make a table of values for these two functions. Following is

Examining a related problem, how to explain this strategy? how to do this s...

how to explain this strategy? how to do this strategy in solving a problem? can you give some example on how to solve this kind of strategy.

Fraction word problem, castor brought 6 3/4 carat cakes to share with 26 st...

castor brought 6 3/4 carat cakes to share with 26 students. did castor bring enough for each student to have 1/4 of cake?

Progressions, We will look at three types of progressions called Ar...

We will look at three types of progressions called Arithmetic, Geometric and Harmonic Progression. Before we start looking at the intricacies of these let us unders

Differential equations and group methods, solve the differential equation ...

solve the differential equation dy/dx=f(y)x^n+g(y)x^m by finding a one-parameter group leaving it invariant

Explain histogramsin details, Explain Histogramsin details? Another way...

Explain Histogramsin details? Another way to display frequencies is by using a histogram. The following is an example of a histogram using the data from the previous example:

Gaussian elimination, Example1 :  Solve the subsequent system of equations....

Example1 :  Solve the subsequent system of equations. -2x 1 + x 2 - x 3 = 4 x 1 + 2x 2 + 3x 3   = 13 3x 1 + x 3 = -1 Solution The initial step is to write d

Write Your Message!

Captcha
Free Assignment Quote

Assured A++ Grade

Get guaranteed satisfaction & time on delivery in every assignment order you paid with us! We ensure premium quality solution document along with free turntin report!

All rights reserved! Copyrights ©2019-2020 ExpertsMind IT Educational Pvt Ltd