Q. Introduction to the Normal Distribution?
Ans.
The Binomial distribution is a model for what might happen in the future for a discrete random variable. The Normal Distribution is a model for continuous random variables that often occurs in practice and it is therefore the most important continuous probability distribution in statistics!
The Bell Curve
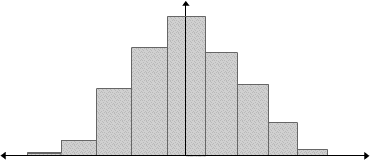
The normal distribution occurs regularly in practice, for example, suppose a paper supply company repeatedly measures a ream (500 sheets) of paper. The measurements that they gather can be represented by the histogram below.

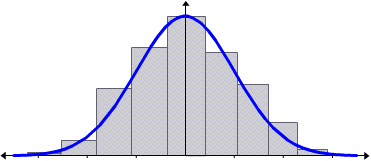
If we connect the center of each bar with a smooth curve, we get a bell-shaped curve, called the normal curve.

Notice that this curve is symmetric about the central axis. The mean, median and mode are equal and occur at the peak of the curve.
Theoretically, the normal curve extends infinitely in both directions. It gets very close to x-axis, but never touches it. The total area under the curve is equal to 1. The area on the right side of the mean is 0.5 and the area on the left side of the mean is also 0.5.
Although the distribution was discovered earlier, the normal curve is often called the Gaussian curve because the German mathematician, Carl Friedrich Gauss (1777 - 1855) found so many applications for the normal curve.