Individual firm and market supply curves, Managerial Economics

Assignment Help:

Individual firm and market supply curves

The quantities and prices in the supply schedule can be plotted on a graph. Such a graph is called the firm supply curve.

A firm supply curve is a graph relating the price and the quantities of a commodity a firm is prepared to supply at those prices.

The typical supply curve slopes upwards from left to right. This illustrates the second law of supply and demand "which states that the higher the price the greater the quantity that will be supplied".

More is supplied by the firms which could not make a profit at the lower price.

673_market curve.png

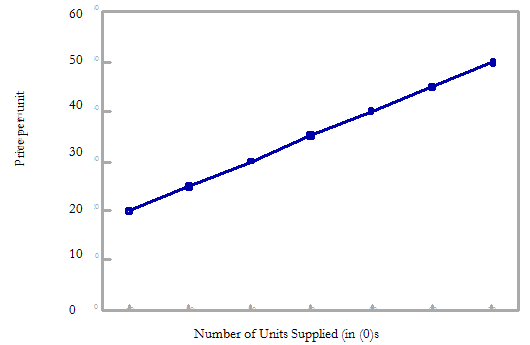
Fig : The firm supply curve

The market supply curve is obtained by horizontal summation of the individual firm supply curves i.e. taking the sum of the quantities supplied by the different firms at each price.

Consider, for the sake of exposition, an industry consisting of two firms. At price P1, firm I (diagram below) supplies quantity q1, firm II supplies quantity q2, and the total market supply is q1+q2

At price P2, firm I supplies q'1, firm II supplies quantity q'2, and the total market supply is q'1+q'2,. SS is the total market supply curve.


Related Discussions:- Individual firm and market supply curves

Demand, what is demand estimation

what is demand estimation

What is lerner’s index, Antitrust authorities at the Federal Trade Commissi...

Antitrust authorities at the Federal Trade Commission are reviewing your company's recent merger with a rival firm. The FTC is concerned that the merger of two rival firms in the s

Ramsey pricing, explain in detail ramsey pricing with example?

explain in detail ramsey pricing with example?

Income elasticity, Income Elasticity The functional relationship among ...

Income Elasticity The functional relationship among the changes in the quantity demanded for a good or service and the change in income of those persons demanding the good or s

Construction of an explanatory model, Q. Construction of an explanatory mod...

Q. Construction of an explanatory model? Construction of a sample:   To apply multiple regression a large sample is generally essential (ideally between 2,000 to 15,000 indivi

Economics, What limitations are inherent in the economist’s view of pricing...

What limitations are inherent in the economist’s view of pricing?

Can identity economics explain some patterns , Can identity economics expla...

Can identity economics explain some patterns observed in the Australian economy

Central bank functions-custodian of member cash reserves , Custodian of Mem...

Custodian of Member Banks Cash Reserves As bankers bank the central bank performs several function. It keeps the cash reserves of commercial banks in the economy and thus acts

GAME THOUGH, Given the following payoff matrix (a) indicate the best str...

Given the following payoff matrix (a) indicate the best strategy for each firm (b) why is the entry deterrent threat by firm Ato lower the pruce not credible

Explain the shut down point, Q. Explain the Shut down point? ShutdownP...

Q. Explain the Shut down point? ShutdownPoint: With MR = MC, firm attains equilibrium at point E where it produces OM amount of the output. To produce this output, firm incur

Write Your Message!

Captcha
Free Assignment Quote

Assured A++ Grade

Get guaranteed satisfaction & time on delivery in every assignment order you paid with us! We ensure premium quality solution document along with free turntin report!

All rights reserved! Copyrights ©2019-2020 ExpertsMind IT Educational Pvt Ltd