Individual demand curve - effect of price change, Microeconomics

Assignment Help:

Individual Demand

* The Individual Demand Curve 

- Two significant Properties of Demand Curves

- 1) The level of utility which can be attained changes while moving along the curve.

- 2) At every instant on demand curve, the consumer is maximizing utility by fulfilling the condition that the MRS of food for clothing equals the ratio of prices of food and clothing.

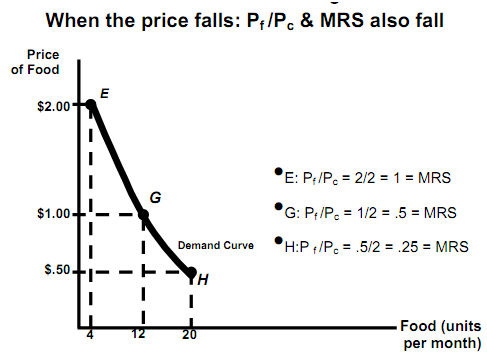
Effect of Price Change
1120_individual demand.png

Individual Demand

* Income Changes

- Using figures developed earlier, the impact of a change in income can be illustrated by using indifference curves.
1178_individual demand1.png
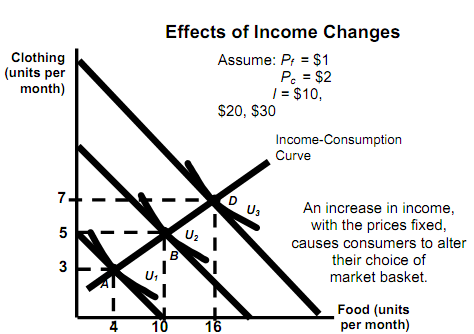
Effects of Income Changes

634_individual demand2.png
- The income-consumption curve traces out utility maximizing combinations of food and clothing linked with every income level.

- An increase in income shifts budget line to right, increasing consumption along income-consumption curve.

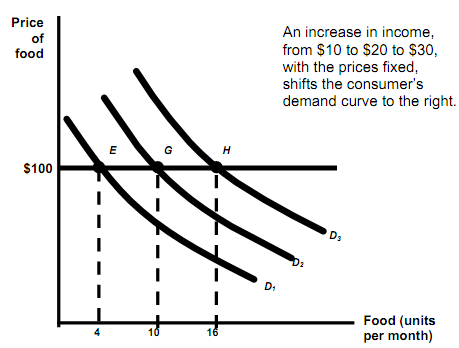
- At the same time, increase in income shifts demand curve to right.

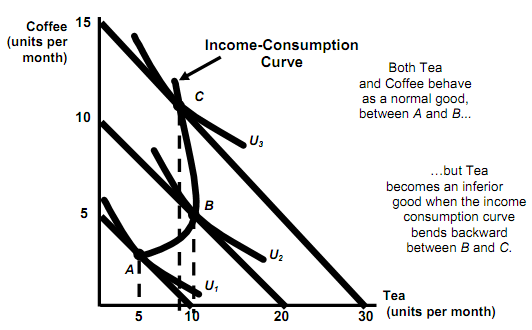
* Normal Good vs. Inferior Good

-  Income Changes

  • When income and consumption curve is having positive slope:

-The quantity demanded increases with the increase income.

-The income elasticity of demand is positive in nature.

-The product is a normal good.

  • When income consumption curve is having negative slope:

    -The quantity demanded decreases with the increase in income.

-The income elasticity of demand is negative in nature. 

-This good is an inferior good.

An Inferior Good

2160_individual demand3.png


Related Discussions:- Individual demand curve - effect of price change

Assignment, illustrate graphically the influence of an increase in immigran...

illustrate graphically the influence of an increase in immigrants on the market supply of labour

Performance of public sector enterprises, Performance of Public Sector Ente...

Performance of Public Sector Enterprises: Data reveal that the performance of the much-maligned public enterprises has shown a distinct improvement during the last 9 years. Gr

Various intermediate quantities, An economy can produce a maximum of either...

An economy can produce a maximum of either 28 million tons of wheat or 7,000 automobiles, or various intermediate quantities, as depicted in the table below:

Profits, explain normal profits

explain normal profits

Chapter four, what is the relation ship between mp,tp,ap

what is the relation ship between mp,tp,ap

Employment and unemployment policy, EMPLOYMENT AND UNEMPLOYMENT POLICY: ...

EMPLOYMENT AND UNEMPLOYMENT POLICY: Engagement of a person in any economic activity is central to the concept of identifying a worker. A worker is one who participates in any

Summary of common property resource management , Normal 0 false...

Normal 0 false false false EN-IN X-NONE X-NONE MicrosoftInternetExplorer4

Write Your Message!

Captcha
Free Assignment Quote

Assured A++ Grade

Get guaranteed satisfaction & time on delivery in every assignment order you paid with us! We ensure premium quality solution document along with free turntin report!

All rights reserved! Copyrights ©2019-2020 ExpertsMind IT Educational Pvt Ltd