INDEX NUMBERS OF PRODUCTION
Among the commonly used economic indicators to monitor current trends in the economy are indices of production. The main aggregative indices used to keep track of productive activity are index of industrial production and index of agricultural production.
The index number of industrial production which is regularly published in "Monthly Statistics of Production of Selected Industries" is a quantity index which covers mining; manufacturing and electricity generation. It does not include construction. In its latest version it incorporates 352 items and uses 1970 as the base
year. Of these, 61 items are from mining and quarrying, 290 from manufacturing and the remaining item is electricity. The index formula is I = 
Where Ri is the "production relative" for item i, i.e. the ratio of output of item i in current year to its output in the base year and Wi is the weight attached to item i. This weight is the share of item i in the net value added in the base year. Physical production data are used to calculate the Ri for most of the items; for the remaining, value of output is used deflated by the wholesale price index (base 1970). For mining and quarrying items an index is supplied by the Indian Bureau of Mines which is then combined with manufacturing and electricity to get the overall index. Data for the latter are compiled in CSO. The index is given in a crude form and a seasonally adjusted form. This adjustment removes the effects of seasonal ups and downs over a year's cycle in the production of many industries.
Proportionate changes in the index of industrial production are used as a measure of growth in industrial output. Apart from the CSO publication cited above, the index is reported in a number of other publications.
Though the index of industrial production with 1970 as the base is widely used for measuring industrial performance it has some serious drawbacks. First, the weights are badly out of date. As we have seen, the weights attached to the various component industries should reflect their relative importance in the industrial sector. The industrial structure of the Indian economy has changed substantially since 1970. The result of using the 1970 weights is that today's high growth industries like chemicals, petrochemicals, electronics, readymade garments, gem cutting, etc. have very low weights attached to them (some are not even included) while some declining or stagnant industries such as cotton textiles (mill sector) get disproportionately large weight. Secondly, the index is confined to medium and large scale industries to the exclusion of small scale industries. The latter not only account for nearly half of the value of industrial output but have also experienced much faster growth compared to the medium and large industries. Ignoring small scale production altogether is a very serious limitation.
The combined result of these two deficiencies is that the index understates the growth of industrial production. A comparison of the index with another based on annual survey of industries reveals that over the period 1974-75 to 1982-83 the annual growth rate is underestimated by as much as 3.6% per annum1 . The exclusion of small industries also gives a misleading picture about the growth of some specific industry groups such as manufacture of radio receivers where production has shifted predominantly to small scale units. In the index of industrial production such industries show a negative growth rate whereas they have experienced healthy growth.
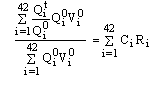
The index of agricultural production covers 42 crops under two main groups viz., food grains and non-food grains. The former includes cereals and pulses while the latter has oilseeds, fibers, plantation crops, spices, fruits and vegetables and a category called "miscellaneous crops". The index formula is:-
It =