Illustration of plot function, C/C++ Programming

Assignment Help:

Illustration of Plot function:

To be more common, the script could prompt the user for the time and temperature, instead of just assigning the values. Then, the axis function could be used depending on whatever the values of x and y is, for illustration,

axis([x-2 x+2 y-10 y+10])

In order to plot more than one point, x and y vectors are formed to store the values of the (x,y) points. For illustration, to plot the points

(1,1)

(2,5)

(3,3)

(4,9)

(5,11)

(6,8)

At first an x vector is formed which has the x values (as they range from 1 to 6 in steps of 1, the colon operator can also be used) and then a y vector is formed with the y values. This will generate (in the Command Window) x and y vectors and then plot them as shown in figure:
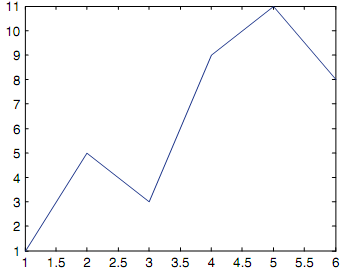
2402_Illustration of Plot function.png


>> x = 1:6;

>> y = [1 5 3 9 11 8];

>> plot(x,y)

Note that the points are plotted with straight lines drawn in between. The axes are also set up according to the data; for illustration, the x values ranges from 1 to 6 and the y values from 1 to 11, and hence, that is how the axes are set up.

Also, note that in this situation the x values are the indices of the y vector (the y vector has 6 values in it, therefore the indices iterate from 1 to 6). Whenever this is the situation, it is not essential to generate the x vector. For illustration,

>> plot(y)

will plot exactly the similar figure without using an x vector.


Related Discussions:- Illustration of plot function

Equation, My project is compiling but the equation entered is not working

My project is compiling but the equation entered is not working

Explain the following object oriented methodologies, Question 1 Explain th...

Question 1 Explain the following Object Oriented Concepts with suitable examples for each Question 2 Explain the following Object Oriented Methodologies Question 3 Descr

Explain topologies for the network information system, Problem: a) Give...

Problem: a) Give and Illustrate with the help of diagrams, four topologies for the Network Information System (NIS). b) Give methods for creating user accounts and groups.

Decompression of files compressed with LZW, The files are meteorological ra...

The files are meteorological radar data whose decompression is badly needed for relative study. Please contact Kathy Lee (Email: ; Cell phone: 0086 15701799056) or Mr. Zhu (Email:

Describe what are dynamic pointers, Question: (a) Describe what are dy...

Question: (a) Describe what are dynamic pointers. Show their memory representations diagrammatically. (b) Write short notes about pointers in arrays, paying attention on

Develop a c program for linux, develop a C program for Linux called pipes.c...

develop a C program for Linux called pipes.c that does the following: In the main() function, it creates a pipe using the pipe() function, then creates two child processes with

Word counting, Task Your task is to write a program, words, that reports i...

Task Your task is to write a program, words, that reports information about the number of words read from its standard input. For example, if the file qbf.txtcontains the text th

Explain abstract classes, Abstract Classes Abstract classes are the cla...

Abstract Classes Abstract classes are the classes, which are written just to act as base classes. Consider the following classes.                 class base

Program for read a formal expression from standard input, Your program will...

Your program will read two kinds of data from two files: names and predicates. It will read a formal expression from standard input and check whether that expression is syntactical

Write Your Message!

Captcha
Free Assignment Quote

Assured A++ Grade

Get guaranteed satisfaction & time on delivery in every assignment order you paid with us! We ensure premium quality solution document along with free turntin report!

All rights reserved! Copyrights ©2019-2020 ExpertsMind IT Educational Pvt Ltd