Illustration of marginal profit, Managerial Accounting

Assignment Help:

Illustration of Marginal profit

To illustrate the computations, suppose that the marginal profit or XE in our model is changed from 3 to 3 + δ1, where δ represents either positive or negative change. This means that the objective function reads as: Z = (3 + δ1) XE + 2XI.

If we use this information in the starting tableau and carry out the same arithmetic operations used to produce the optimum tableau, the optimum Z equation will appear as:

1015_table1.jpg


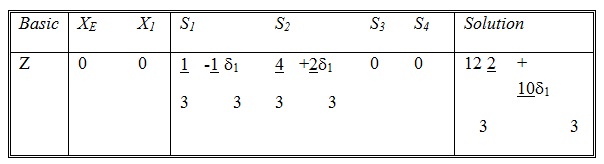
This equation is the same as the optimum Z equation before the change δ1 is effected, modified by terms of δ1. The coefficients of δ1 are essentially those in the XE equation of the optimum tableau, which are

Pivot Element

2322_table2.jpg


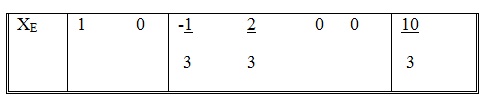
We choose the XE equation because XE is the variable whose objective coefficient is being changed by δ1.

The change δ1 will not affect the optimality of the problem as long as all the Z equation coefficients of the non-basic variables remain non-negative (maximization) that is:

1/3 - δ1/3 ≥0

4/3 + 2δ1/3 ≥ 0  

First Relationship  shows that δ1 ≥ 1 and the relation second yields δ1 ≥ -2.  Both relations limit δ1 by -2 ≤ δ1 ≤ 1. This means that the coefficient of XE can be as small as 3 + (-2) = 1 or as large as 3 + 1 = 4 without causing any change in the optimal values of the variables. The optimal value of Z, however, will change according to the expression 12 2/3 + 10/3 δ1 where -2 ≤ δ ≤ 1.

The foregoing discussion assumed that the variable whose coefficient is being changed has an equation in the constraints. This is true only if the variable is basic (such as XE and XI above). If it is non-basic, it will not appear in the basic column.

The treatment of non-basic variable is straight forward. Any change in the objective coefficient of a non-basic variable will affect only that coefficient in the optimal tableau. To illustrate this point, consider changing the coefficient of SI (the first slack variable) from 0 to 0 + δ3. If you carry out the arithmetic operations leading to the optimum tableau, the resulting Z equation becomes:

417_table3.jpg

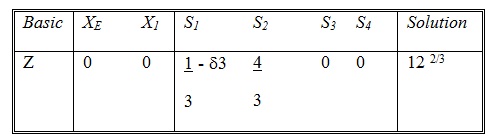
It shows that the only change occurs in the coefficient of SI, where it is decreased by δ3. As a general rule, then, all we have to do in the case of a non-basic variable is to decrease the Z coefficient of the non-basic variable by the amount by which the original coefficient of the variable is increased.


Related Discussions:- Illustration of marginal profit

Estimating working capital requirements, The most ticklish difficulty that ...

The most ticklish difficulty that is faced through the finance manager is the resolve of the amount of working capital requirement at a specific level of production. To resolve thi

Example of credit period, M/s ABC has an existing sales of Rs.50 lakhs and ...

M/s ABC has an existing sales of Rs.50 lakhs and permits a credit period of 30 days to its customers.  The firm cost of capital is 10% and the ratio of variable cost to sales is 85

Advantages of value added statements, Advantages of Value Added Statements ...

Advantages of Value Added Statements 1) Managers might be in a better position to control their organizations own inputs than the cost and usage efficiency of purchased materia

Periodic system and a perpetual system, Your manager has informed you that ...

Your manager has informed you that the company is trying to determine if it should use a periodic system or a perpetual system in accounting for the inventory. He wants you to spea

Profi t Planning, Master budgeting Jaya Sdn. Bhd. is a wholesaler. The mana...

Master budgeting Jaya Sdn. Bhd. is a wholesaler. The management of Jaya Sdn. Bhd. has been extremely worried about the company''s cash position over the last few years. In July 201

Explain the interpretation of equity ratio, Interpretation of equity ratio ...

Interpretation of equity ratio As equity ratio show the relationship of owner funds to total assets higher the ratio or the share of the shareholders in the total capital of th

How can we draw a break even chart, How can we draw a break even chart ...

How can we draw a break even chart Under this method the variable cost line is drawn first and then fixed cost line is drawn over and parallel to the variable cost line. The fi

Write Your Message!

Captcha
Free Assignment Quote

Assured A++ Grade

Get guaranteed satisfaction & time on delivery in every assignment order you paid with us! We ensure premium quality solution document along with free turntin report!

All rights reserved! Copyrights ©2019-2020 ExpertsMind IT Educational Pvt Ltd