Illustration of image processing, MATLAB in Engineering

Assignment Help:

Illustration of Image processing:

This displays that there are 64 rows, or in another word, 64 colors, in this specific colormap. It also displays that the first five colors are shades of blue.

The format of calling the image function is as shown below:

image(mat)

here the matrix mat is a matrix which represents the colors in an m × n image. When the matrix has the size m × n, then each and every element is an index into the present colormap.

The one way to show the colors in the jet colormap (that has 64 colors) is to generate a matrix which stores the values 1 through 64, and pass that to the image function, as shown in figure.

2081_Illustration of Image processing.png

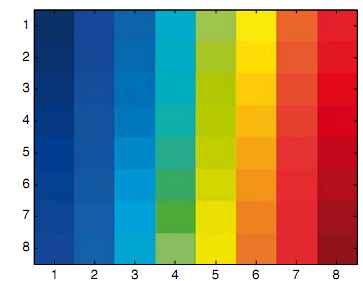
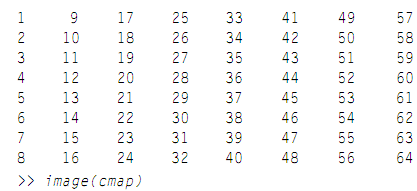
Whenever the matrix is passed to the image function, then the value in each element in matrix is used as an index into the colormap. For illustration, the value in cmap(1,2) is 9, therefore the color displayed in position(1,2) in the image will be the color presented by the ninth row in the colormap. By using numbers 1 through 64, we can see all colors in this colormap.

>> cmap = reshape(1:64, 8,8)

cmap =

1687_Illustration of Image processing1.png


This represents that the first colors are shades of blue, the end colors are shades of red, and in between there are shades of aqua, green, yellow, & orange.


Related Discussions:- Illustration of image processing

Expanding a function, Expanding a function: The expand function will m...

Expanding a function: The expand function will multiply out terms, and factor will do the opposite: >> expand((x+2)*(x-1)) ans = x^2 x-2 >> factor(ans)

Filter, A matlab function to calculate filter order

A matlab function to calculate filter order

Showing cell array elements and attributes, Referring to and Showing Cell A...

Referring to and Showing Cell Array Elements and Attributes: Just as with the other vectors, we can refer to individual elements of the cell arrays. The only difference is tha

Example of gauss-jordan, Example of Gauss-jordan: For a 2×2 system, th...

Example of Gauss-jordan: For a 2×2 system, this would results and for a 3 × 3 system, Note that the resulting diagonal form does not involve the right-most col

Indexing into vectors of structures, Indexing into Vectors of structures: ...

Indexing into Vectors of structures: Frequently, when the data structure is a vector of structures, it is essential to iterate through the vector in order by various fields. F

Creating the structure variables, Creating the structure Variables: Cr...

Creating the structure Variables: Creating a structure variable can be accomplished by simply storing the values in fields by using assignment statements, or by using the stru

Illustration of sound signals, Illustration of Sound files: For illust...

Illustration of Sound files: For illustration, the following script generates a subplot which shows the signals from chirp and from train, which is as shown in figure:

Illustration of gauss-jordan elimination, Illustration of gauss-jordan elim...

Illustration of gauss-jordan elimination: An illustration of interchanging rows would be r1 ¬→ r3, that would results: Now, beginning with this matrix, an illustration of sc

Example of plotting from a function, Example of Plotting from a Function: ...

Example of Plotting from a Function: For illustration, the function can be called as shown below:      >> y = [1:2:9].^3      y =     1  27  125  343  729

Readlenwid function - subfunctions, readlenwid function: function cal...

readlenwid function: function call: [length, width] = readlenwid; function header: function [l,w] = readlenwid In the function call, not any argument is passed; henc

Write Your Message!

Captcha
Free Assignment Quote

Assured A++ Grade

Get guaranteed satisfaction & time on delivery in every assignment order you paid with us! We ensure premium quality solution document along with free turntin report!

All rights reserved! Copyrights ©2019-2020 ExpertsMind IT Educational Pvt Ltd