Illustration of a recursive function, MATLAB in Mathematics

Assignment Help:

Illustration of a recursive function:

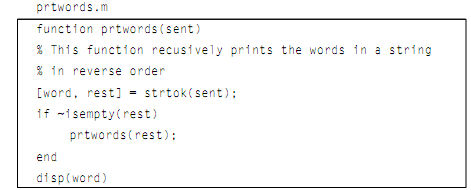
illustration is of a recursive function which does not return anything, but simply prints. The below function prtwords receives a sentence, and prints words in the sentence in the reverse order. The algorithm for prtwords function is as shown below:

  •  Receive a sentence as input argument.
  •  Use strtok to split the sentence into the first word and the rest of the sentence.
  •  If the rest of the sentence is not blank (in another words, if there is more to it), recursively call the prtwords function and pass to it the rest of the sentence.
  •  Print the word.

The function definition is as shown:

1179_Illustration of a recursive function.png

An example of calling the function passes the sentence "what does this do":

>> prtwords('what does this do')

do

this

does

what

What occurs when the function is called here is outlined as shown.

1054_Illustration of a recursive function1.png

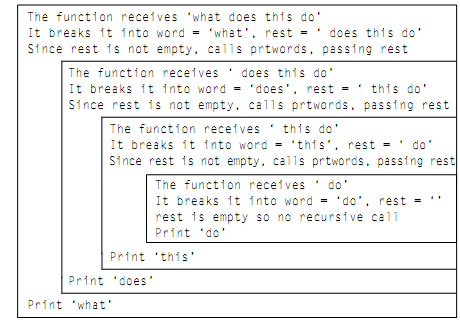
In this illustration, the base case is when the rest of the string is empty; in another words, the end of the original sentence has been reached. Each time the function is called, then the execution of the function is interrupted by a recursive call to the function, till the base case is reached. Whenever the base case is reached, the whole function can be executed, involving the printing of the word (in the base case, the word 'do'). The execution of the function is once completed, the program returns to the earlier version of the function in which the word was 'this', and finishes the execution by printing the word 'this'. This continues; the versions of the function are completed in the reverse order, therefore the program ends up printing the words from the sentence in the reverse order.


Related Discussions:- Illustration of a recursive function

Standard deviation, Standard Deviation The standard deviation is the sq...

Standard Deviation The standard deviation is the square root of variance: The built-in function in a MATLAB for the standard deviation is known as std; the standard dev

Refer the subset of a matrix, Refer the subset of a matrix: It is also...

Refer the subset of a matrix: It is also possible to refer to the subset of a matrix. For illustration, this refers to the first & second rows, second & third columns: >> m

Print an imaginary number, Print an imaginary number: To print an imag...

Print an imaginary number: To print an imaginary number, the function disp will show both parts automatically: >> disp(z1)    4.0000 + 2.0000i The function fprint

Function xlsread - file function, Function xlsread - file function: Th...

Function xlsread - file function: The function xlsread will read from the spreadsheet file. For illustration, to read from file just generated: >> ssnums = xlsread('ranexc

Cholesky factorisation of packed storage matrix, If I have a vector represe...

If I have a vector representing the packed storage form of a symmetric matrix, how do I perform a cholesky factorisation on that?

Example of logical built-in functions, Example of Logical built-in function...

Example of Logical built-in functions: For equivalent to all the function, we should make sure that the entire elements in the vector are logically true. The one way of doing

Animation, Animation: In this part we will observe a couple of ways to...

Animation: In this part we will observe a couple of ways to animate a plot. These are visuals, therefore the outcomes can't really be shown here; it is essential to type these

Pie chart - plot functions, Pie chart - plot functions: The MATLAB als...

Pie chart - plot functions: The MATLAB also has a function pie which will generate a pie chart. Calling the function with the form pie (vec) draws a pie chart, by using the pe

Three-dimensional pie and bar, Three-dimensional pie and bar: For the ...

Three-dimensional pie and bar: For the bar3 function, x & y vectors are passed and the function displays three-dimensional bars as shown in figure: Figure: Three-dimen

Histogram - plot functions, Histogram: The histogram is a particular t...

Histogram: The histogram is a particular type of bar chart which shows the frequency of occurrence of the values within a vector. The Histograms use what are known as bins to

Write Your Message!

Captcha
Free Assignment Quote

Assured A++ Grade

Get guaranteed satisfaction & time on delivery in every assignment order you paid with us! We ensure premium quality solution document along with free turntin report!

All rights reserved! Copyrights ©2019-2020 ExpertsMind IT Educational Pvt Ltd