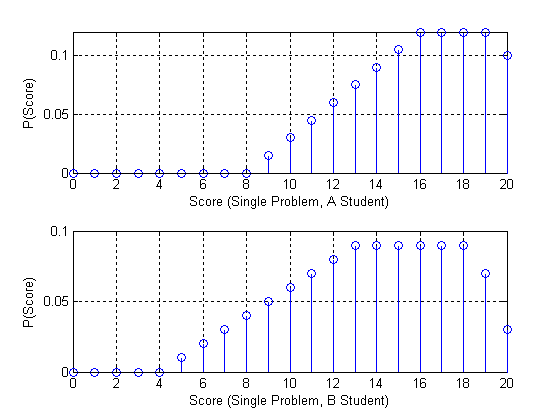
An instructor wants to determine which of his students are A students and which are B students (this is a graduate course, so clearly all the students are either A or B students). The instructor gives a test to make this determination. This test contains 5 questions each worth 20 points. Both the A and B students will miss questions due to silly errors, incomplete knowledge (nobody is perfect), and time pressure (running out of time). The probability mass functions for the A and B students (single question) are given below. Note that these probability mass functions are piecewise linear (this should help in getting the numbers.)

1. Given the total test score, generate a hypothesis test to minimize the probability of error assuming that 60% of the students are B students and 40% are A students. For your hypothesis test, compute the probability that the instructor gives a student an A (student is segregated into the A group) if he deserves a B. Compute the probability that the instructor gives a student a B if he deserves an A.
2. You will need the density function for the test scores for both A and B students to be able to derive your hypothesis test. You should verify that you have the correct results by simulating the system and approximating the probabilities via statistics. You should also verify your probabilities of giving the student the wrong grade via your simulation. Note that the probability of a given score is approximated:
P(score) = # with score/total #.
3. Some of you are probably saying: "What happens if we are all A students!!!" You are thinking that it is unfair to ascribe a priori that only 40% of the students are A students. We can avoid this a priori assumption by using the minimax test. Generate a minimax hypothesis test to segregate the students into A and B students. For the minimax hypothesis test, compute the probability that the instructor gives a student an A (student is segregated into the A group) if he deserves a B. Compute the probability that the instructor gives a student a B if he deserves an A.
4. What happens if the instructor gives harder questions? In this case, assume the source probabilities in 1. Now, the probability mass functions for the A and B students (single question) are given below. Note that these probability mass functions are again piecewise linear. Further, the probability mass function for the A students is the same as the previous probability mass function for the B students. Generate a hypothesis test for this case. For this test, compute the probability that the instructor gives a student an A (student is segregated into the A group) if he deserves a B. Compute the probability that the instructor gives a student a B if he deserves an A.
5. What happens if the instructor gives a shorter test? In this case, assume that there are four questions, each question is worth 25 points, and the source probabilities are as given in 1. Also assume that due to less time pressure, students do better on these questions. The probability mass functions for the A and B students (single question) are given below. Note that these probability mass functions are again piecewise linear. Generate a hypothesis test for this case. For this test, compute the probability that the instructor gives a student an A (student is segregated into the A group) if he deserves a B. Compute the probability that the instructor gives a student a B if he deserves an A.
Hand in:
1. A description of the hypothesis tests (should be four) with the derivation of relevant results. The probabilities of giving an A to a B student, and giving a B to an A student for each test should be included. Make a table of these probabilities for easy comparison.
2. Make sure to include enough equations and verbage (but it does not have to be long) so that I can follow what you did and verify that you did it correctly.
3. The details of your simulation program with enough documentation to be easily understood. Include the data indicating that your probabilities are correct. Note you only have to simulate the first case, but you can use your simulation to confirm the other cases if desired.
4. Comments on the results. These should include a statement concerning whether you want short tests, long tests, hard tests, or easy tests. Justify this statement with the results of this project.