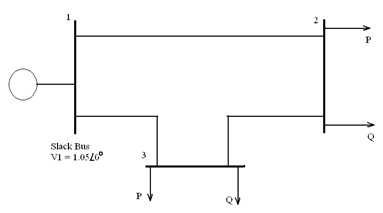
A one-line diagram of a simple three-bus power system is shown in Figure 1 with generation at bus 1. The magnitude of voltage at bus 1 is adjusted to 1.05 per unit. The scheduled loads at bus 2 and 3 are as shown in Table 1. Line impedances are as shown in Table 2 and are marked on in per-unit on a 100- MVA base and the line susceptances are neglected. (Note: Each student will use be assigned the parameters on either Table 1a or Table 1b and either Table 2a or table 2b).
2a. Using either the Gauss-Siedel or Newton-Raphson Method, determine the phasor value of the voltage at load buses 2 and 3 (P-Q buses), analytically.
2b. Using either the Gauss-Siedel or Newton-Raphson Method, determine the phasor value of the voltage at load buses 2 and 3 (P-Q buses) using Matlab.
2c. Find the slack bus real and reactive power.
2d. Determine the line flows and line losses. Construct a power flow diagram showing the direction of line flow.
2e. Explain the steps that was carried out in the load flow analysis.
Figure
Table 1b Real and Reactive Power
|
Bus
|
Real Power (Pi) MW
|
Reactive Power (Qi) Mvar
|
Voltage (Vi) p.u.
|
Type
|
|
1
|
|
|
1.00Ð0º
|
Slack Bus
|
|
2
|
260.2
|
115.2
|
|
PQ Bus
|
|
3
|
145.6
|
55.2
|
|
PQ Bus
|
Table 2b Line Impedances
|
Element
|
Impedance
|
|
1 - 2
|
0.03 + j0.05
|
|
2 - 3
|
0.0115 + j0.035
|
|
1 - 3
|
0.015 + j0.035
|
Solution should include:
1. Calculation of admittances
a. Calculation process
b. Detailed one line diagram showing admittances
2. Detailed calculation of the phasor voltages using a number of iterations.
a. Calculation process
b. Accuracy of the phasor voltage (minimum of four decimal places)
3. Detailed calculation of slack bus power
4. Detailed calculation of line currents
a. Detailed calculation process
b. Power flow diagram
5. Matlab Solution
a. M-File (soft and hard copy)
b. Accuracy of result
6. Analysis of load flow process done.
a. Analysis should include the significance of using either the Gauss-Siedel or Newton-Rapson Method,