Function Functions:
The one reason for using function handles is to be able to pass functions to the other functions-these are known as function functions.
For illustration, let's say we have a function which generates an x vector. The y vector is generated by computing a function at each of the x points, and then such points are plotted.
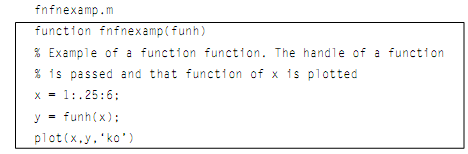
What we want is to be able to pass the function to be the value of funh, such as sin, cos, tan, and so forth. It doesn't work to merely pass the name of the function:
>> fnfnexamp(sin)
??? Error using ==> sin
Not enough input arguments.
Rather than, we have to pass the handle of the function:
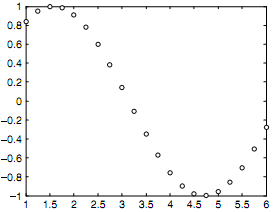
>> fnfnexamp(@sin)
which generates the y vector as sin(x) and then brings up the plot as shown in figure.
Passing rather the handle to the cos function would graph cosine rather than of sine:
>> fnfnexamp(@cos)
We can also pass the handle of any user-defined or anonymous function to the fnfnexamp function.
The other way of doing this is to use the built-in function str2func which will convert a string into a function handle:
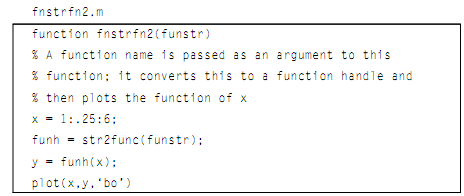
This would also be called by passing a string to the function, and again would generate the similar plot:
>> fnstrfn2('sin')
There is also a function func2str which will convert a function handle into a string. This can be used to put the name of the function in the plot as shown in above figure.
Though these techniques also work, it seems easier and cleaner to merely pass the function handle to the function.
The MATLAB has few built-in function functions. The one built-in function is fplot that plots a function between the limits which are specified. The format of the call for fplot is:
fplot(fnhandle, [xmin xmax])