Fraction defective p chart - control charts for attributes, Operation Management

Assignment Help:

Fraction Defective P Chart - Control Charts for Attributes

This type of chart is used when it is impractical or inconvenient to maintain a constant sample size. Instead of plotting the number of defectives in each sample, the proportion (p) or fraction of defectives is calculated and then plotted. Clearly, to ensure that meaningful plots are made, the sample sizes must be large enough to ensure that a number of defectives will typically be found. This may seem to imply that some level of non-conformance is being accepted, but this is not necessarily so. For example, consider the Go/Not-go gauging example shown in the figure on page 249. Whilst the design limits of size on the component diameter might be, say, 24.98 mm and 25.02 mm; for process control purposes the gaps in the gauge might be set at, say, 24.99 and 25.01 respectively. Remembering that, for attributes, only two states are possible (defective/non defective) the relevant probability distribution is the binomial distribution, the mean of which (¯p) can be estimated by inspecting a large number of items:

¯p = total number of defectives/ total number inspected

An estimate of the standard deviation of the binomial distribution (σp), for samples of size n is given by:

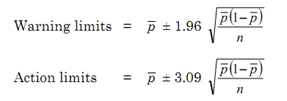
σp = √(¯p (1-¯p) / n)

For small values of n the profiles of the binomial distributions are distinctly skewed, but, for large values of n and, particularly, when the product p n is greater than about 5, the distributions are sufficiently symmetrical to be well-approximated by the normal distribution. In this latter situation the control chart limits can be determined in the same manner as for variables charts.

2206_Fraction Defective P Chart - Control Charts for Attributes.png

It will be realised that the implied constant sample size (n) in these expressions presents some difficulty in a procedure when the sample size is allowed to vary. This can be surmounted by using an average value for n, and limiting variation in the size of subsequent samples to, say, ±20 per cent of this value: the results will still be sufficiently accurate for most process control purposes.


Related Discussions:- Fraction defective p chart - control charts for attributes

Assignable causes - causes of variability, Assignable Causes - Causes of Va...

Assignable Causes - Causes of Variability Variability in process output may also be the result of external causes which are separately identifiable, and which are not inherent

Loading, what is significance of loading?

what is significance of loading?

Industrial production, Industrial Production The output of U.S. factori...

Industrial Production The output of U.S. factories is mines, and utilities. This output constitutes the production of things like the goods, portion of goods, and the services.

Can someone help describe what to do, I feel like there is not enough infor...

I feel like there is not enough information to even start. Can someone help explain what to do? Maybe if I can start, then I can do the rest on my own.

How enhance ethical behavior at work, Discuss options companies use to enha...

Discuss options companies use to enhance ethical behavior at work

Explain reasonable accommodation to his religious beliefs, Ras is a member ...

Ras is a member of the Rake Religion whose practice forbids using yard rakes for any other reason than worship. Three times a week, Ras attends religious services where a silver ra

How differentiate company products, How do marketers position and different...

How do marketers position and differentiate their company's products/services relative to competition? Provide examples in either the fast-food, hotel, airline or restaurant busine

Explain what aspects of servant leadership does the leader, I need help wit...

I need help with a three page paper, due on Sunday. Ashford Library to research living or deceased, who you admire. Explain whether the leaders style is transactional or transforma

Explain does anyone have any insight, Does anyone have any insight into Dis...

Does anyone have any insight into Discussion Question, This was not discussed in class.

Find which city provides the lowest overall costs, Kelly Trucking, Inc., is...

Kelly Trucking, Inc., is planning a new warehouse to serve the western United States. Denver, Santa Fe, and Salt Lake City are under consideration. For each location, annual fixed

Write Your Message!

Captcha
Free Assignment Quote

Assured A++ Grade

Get guaranteed satisfaction & time on delivery in every assignment order you paid with us! We ensure premium quality solution document along with free turntin report!

All rights reserved! Copyrights ©2019-2020 ExpertsMind IT Educational Pvt Ltd